Segmentation and Recognition of Korean Vehicle License Plate Characters Based on the Global Threshold Method and the Cross-Correlation Matching Algorithm
Article information
Abstract
The vehicle license plate recognition (VLPR) system analyzes and monitors the speed of vehicles, theft of vehicles, the violation of traffic rules, illegal parking, etc., on the motorway. The VLPR consists of three major parts: license plate detection (LPD), license plate character segmentation (LPCS), and license plate character recognition (LPCR). This paper presents an efficient method for the LPCS and LPCR of Korean vehicle license plates (LPs). LP tilt adjustment is a very important process in LPCS. Radon transformation is used to correct the tilt adjustment of LP. The global threshold segmentation method is used for segmented LP characters from two different types of Korean LPs, which are a single row LP (SRLP) and double row LP (DRLP). The cross-correlation matching method is used for LPCR. Our experimental results show that the proposed methods for LPCS and LPCR can be easily implemented, and they achieved 99.35% and 99.85% segmentation and recognition accuracy rates, respectively for Korean LPs.
1. Introduction
The number of vehicles is increasing tremendously day by day. Vehicle license plate recognition (LPR) plays an important role in traffic surveillance in today’s world. LPR is a technology that analyzes the images obtained from video or surveillance cameras and obtains the information about these vehicles via computer using computer vision algorithms. The LPR system consists of three key parts: license plate detection (LPD), license plate character segmentation (LPCS), and license plate character recognition (LPCR).
LPD is the initial step of a LPR system. The detection rate of LPD influences the accuracy of the LPR system. We used background subtraction based on an adaptive GMM (Gaussian Mixture Model) and a cascade of boosted classifiers [1] for LPD because our research has been proven to have higher accuracy than other methods. In recent years, researchers have proposed various techniques for LPD, such as the edge-based method [2,3], wind-based method [4], line segments [5], and so on. Recently, learning-based algorithms are widely used for LPD, support vector machines [6], neural network [7], etc. The performance of our proposed method for LPD [1] is significantly faster than other existing methods.
After LPD, most of the LP images are detected with rotation. The accuracy of the LPR system relates to the efficiency of the LPCS. Currently, several algorithms have been developed for LPCS, such as the character projection-based method [8], the pixel distribution density and region pixel concentration-based method [9,10], and the combination of the multimethod binarization method [11], are presented. In this paper, we introduce a new algorithm that combines different image processing algorithms for LPCS, such as image average filtering, visibility restoration, vertical edge-emphasizing, thresholding, morphological operations, and connected component analysis. LPCR is the final and major step after LPCS has been completed in the LPR system Recently, various kinds of optical character recognition (OCR) algorithms have been used for LPCR, such as the template matching technique [12], which is common and very easy to implement; neural networks [13] and support vector machines [14], which are strong and fast classifiers for real-time classification and have significant accuracy; and other least squares-support vector machine (LS-SVM) [15] methods have also been presented for the LPCR process. In this paper, we combined the statistical correlation matching method with the concept of template matching for LPCR. The proposed method is simple and easy to implement, and it has a high recognition rate.
This paper is organized as follows: Section 2 explains the proposed LPCS and LPCR methods. In Section 3, the experimental results show that our proposed method is able to achieve higher segmentation and recognition accuracy than other existing methods. Finally, we present out conclusions in Section 4.
2. Proposed System
The workflow of our proposed system is illustrated in Fig. 1. The procedure consists of four distinct phases: input detected LP images (from our previous work [1]), LPCS, LPCR, output LP numbers, and saved the vehicle information. The details of our system procedures are explained in the next subsection.

The workflow of proposed system.
2.1 Input Detected LP image
The initial step of our proposed system, LPD, has already been done by using background subtraction and a cascade of boosted classifiers in [1], and the result of the LPD is used in this stage as an input image for the next processing step. The accuracy of our proposed LPD system achieved 99.14%, which is higher than other existing methods.
2.2 License Plate Character Segmentation (LPCS)
LPCS is the process of extracting a small region from the LP image, which represents the character of LP. LPCS is a very important part of the LPR system. The accuracy of LPCR is totally dependent on how well the LPCS has been executed. The procedure for our proposed LPCS system is shown in Fig. 2.
The procedure of proposed LPCS.
2.2.1 Image pre-processing
The image pre-processing methods for LPCS are described below.
2.2.1.1 Tilt correction
After LPD, the LP image might appear to be tilted due to the vehicle’s location with respect to the camera. There are two common types of tilts that exits based on the direction and orientation of LP images [16], as shown in Figs. 3 and 4.
Horizontal tilt.
Vertical tilt.
To solve the LP rotation problem, we used the Radon transform (RT), which is similar to the Hough transform [17]. We applied the RT on image f (x,y) for a given set of angles ø, and the result is a new image R(ø,θ) obtained by following:
The RT of an image is the sum of the RTs of each individual pixel. The algorithm first divides pixels in the image into four subpixels and projects each subpixel separately, as shown in Fig. 5.
The basic concept of Radon transform of an image.
Each subpixel’s contribution is proportionally split into the two nearest bins, according to the distance between the projected location and the bin centers. If the subpixel projection hits the center point of a bin, the bin on the axes gets the full value of the subpixel, or one-fourth the value of the pixel. If the subpixel projection hits the border between two bins, the subpixel value is split evenly between the bins. The interpolation method specified by bilinear interpolation [18] to rotate the R(ø,θ) image and to obtained the tilt-corrected images, as shown in Fig. 6(e).
Results of Radon transformation. (a) Original LP images, (b) edge LP images, (c) RT of original LP images, (d) edge images after tilt correction, and (e) LP images after tilt correction.
2.2.1.2 Filtering
Mean filtering is a method of smoothing LP images, and it is simple and easy to implement. It reduces the amount of intensity variation between one pixel and the next. We used the mean filter to reduce the noise in our original LP images after tilt correction. The main idea of mean filtering is to replace each pixel value in an image with the mean (average) value of its neighbors, including itself [19]. This has the effect of eliminating pixel values that are unrepresentative of their surroundings.
where, M is the total number of pixels in the neighborhood N. We used a 3×3 neighborhood of [x,y] that yielded.
Now, if g[x,y] = 1/9 for every [x,y] in the convolution mask, the convolution operation reduces the local averaging operation, as shown in Fig. 7. This result shows that a mean filter can be implemented as a convolution operation with equal weights in the convolution mask (Fig. 8).
The results of mean filtering of LP images. (a) LP images after tilt correction, (b) LP images after mean filtering.
The convolution operation of mean filtering.
2.2.1.3 Visibility restoration
The difficulty of processing LP images is due to the presence of haze, fog, or smoke, which fades the colors and reduces the contrast of the LP image characters. To overcome this problem, we used a visibility restoration [20] algorithm to enhance the LP image visibility in this step. The algorithm is controlled by only a few parameters and consists of: atmospheric veil inference, image restoration, smoothing, and tone mapping. In [21] Koschmieder’s law is presented as:
where, L(x,y) is the apparent luminance and d(x,y) is the distance of the object with intrinsic luminance L0(x,y) at pixel (x,y). LS is the luminance of the sky and k denotes the extinction coefficient of the atmosphere. The intensity of the atmospheric veil is:
Koschmieder’s law [21] can be rewritten in gray and colors levels as:
where, I(x,y) is the observed image intensity (gray level or RGB) at pixel (x,y) and R(x,y) is the reference image intensity without haze, fog, or smoke. As a consequence, instead of seeking to infer the depth-map d(x,y), we equivalently inferred the atmospheric veil V(x,y). The visibility restoration algorithm can thus be decomposed into several steps: estimation of IS, inference of V(x,y) from I(x,y), estimation of R(x,y) by inversing Eq. (5), smoothing to handle noise amplification, and final tone mapping. The restoration of the filtered LP image colors can be performed by solving Eq. (5) with respect to R:
Fig. 9 shows the results of filtered LP images that have been restored in regards to visibility.
The result of visibility restoration of LP images. (a) LP images after mean filtering, (b) LP images after visibility restoration.
2.2.1.4 Vertical edge-emphasizing
For vertical edge-emphasizing, we used the Sobel vertical edge-emphasizing filter with a 2-D order-statistic filter. The Sobel filter uses two 3×3 kernels, which are convolved with the LP image to estimate the derivatives—one for horizontal changes and one for vertical. If we define R as the source image after visibility restoration, and Gx and Gy are the two images that contain the horizontal and vertical derivative estimation at each point, the computations are as follows:
where, * denotes the 2-D convolution operation. Here, the kernel Gx is to make changes in the x direction or edges that run vertically or have a vertical component. Similarly, the kernel Gy is to make changes in the y direction or edges that run horizontally or have a horizontal component [22]. We used the kernel Gx to create our desired vertical edge-emphasizing filter.
The 2-D order-statistics filters are nonlinear spatial filters whose changes are based on ordering or the position of the pixels contained in the image area included by the filter, and then replacing the value of the center pixel with the value determined by the ordering result. For the 2-D order-statistic filtering of a vertical edge-emphasized LP image, a maximum (Max) filter of the kernel size 6×6 is used. The Max filter that selects the intensity of output pixel is equal to the maximum value in the neighborhood of input pixels (kernels) [23]. The domain is equivalent to the structuring element used for binary image operations. It is a matrix that only contains 1’s and 0’s, and the 1’s define the neighborhood for the filtering operation.
2.2.1.5 ROI detection
The projection of a binary image onto a line may be obtained by partitioning the line into bins and finding the number of 1 pixels that are on lines perpendicular to each bin. Projections are compact representations of images, since much useful information is retained in the projection. Horizontal and vertical projections can be easily obtained by finding the number of 1 pixels for each bin in the vertical and horizontal directions. The projection H[x] along the horizontal (rows) and the projection V[y] along the vertical (columns) of a binary image are given by:
There are many characters in a LP image. The vertical projection information is very useful to obtain only the character region in a LP image. So, the threshold segmentation is used for detecting the region of interest (ROI) with the vertical projection information. A global thresholding algorithm is proposed for a segmented number of possible ROIs from the LP image. The global threshold algorithm is defined by:
where, R(x,y) is the image after 2-D order-statistic filtering, V(y) is the intensity value of the vertical projection image, and the threshold is Th. We used different threshold values and found that the maximum threshold value is Th=80 for achieving the best segmentation of ROIs. When Th=80 is used V(y) is defined by:
where, n is the number of pixels of V(y). Now, we can obtain the possible number of ROIs by using Eqs. (12) and (13).
2.2.2 Verify the type of LP
Two types of LPs are available in Korea based on LP character position information, which are a single row LP (SRLP) and double row LP (DRLP). For justifying the type of LP we used the condition based on Eq. (12). The algorithm is as shown below:

2.2.2.1 Single plate segmentation of SRLP
The detected single ROI defines the type of LP as a SRLP, as shown in Fig. 12(d) 1–2. We extracted the single ROI from the original image and do the post-processing for LPCR in the next.
The results of ROI detection. (a) LP images after 2-D order-statistic filtering, (b) LP images vertical projection, (c) LP images after thresholding, and (d) LP images after ROI detected.
2.2.2.2 Upper and lower plate segmentation of DRLP
The detected double ROIs define the type of LP as a DRLP, as shown in Fig. 12(d) 3–4. We extracted the two ROIs from the original image and do the post-processing for LPCR in the next.
2.2.3 Image post-processing
After obtaining the ROIs of SRLP and DRLP, image post-processing techniques were performed and described in the next.
2.2.3.1 Resize the segmented image
After ROI detection, the segmented ROI is resized based on prior knowledge. The Korean LP size and character orientation are shown in Fig. 13.
The size and character orientation of Korean LP. (a) The size of SRLP is 520 mm×110 mm, (b) the size of DRLP is 440 mm×220 mm.
The size of the SRLP is 520 mm×110 mm, and with the information about the character orientation of LP image (in Fig. 13) we were able to resize our ROI images. First, we had to normalize all single ROI images to the SRLP size, and then we could eliminate the pixels with a width of 1 to 30 from the left side and from the right side for those with a width of 490 to 520 because no character position exists in that pixel range. The size of the DRLP is 440 mm×2,200 mm, and it has two parts. We detected these two parts as upper plate ROI and lower plate ROI images. First, we had to normalize all double ROI images to the DRLP size, and then we could remove the pixels for those with a width of 1 to 80 from the left side of the upper plate and from the right side of the upper plate with a width of 360 to 440. We could also do so from the left side of the lower plate for those with a width 1 to 10 and from the right side of the lower plate for those with a width of 430 to 440 because no character position exists in that pixel range. Fig. 14 shows the resized ROI images.
The result of ROI image resizing. (a) LP images after ROI detected, (b) ROI images after resized.
2.2.3.2 Thresholding
For the ROI of SRLP and DRLP images, images should be converted into a binary image based on the global threshold using Otsu’s method [24], which chooses the threshold to minimize the intra-class variance of the thresholded black and white pixels. The threshold operation is regarded as the partitioning of the pixels of an image into two classes of Oc and Bc (objects and background) at grey level n, where, Oc = {0, 1, 2,.., n} and Bc = {n + 1, n +2,…., L−1}. Suppose δW2 is the within-class variance, δB2 is the between-class variance, and δT2 is the total variance. An optimal threshold can be determined by minimizing one of the equivalent principle functions with respect to n [25] as:
With the three principle functions, β is the simplest. So the optimal threshold n is defined as:
where,
Fig. 15 shows the results of Otsu thresholding (OT).
The result of Otsu thresholding. (a) ROI images after resized, (b) ROI images after Otsu thresholding.
2.2.3.3 Morphological operation
Morphological opening and closing are necessary to use since there are is a lot of noise right after ROI image thresholding [1]. The main morphological operations are dilation (⊕) and erosion (⊖). Both dilation and erosion are produced by the interaction of a set known as a structuring element [26] with a set of pixels of interest in the image. The translation of a binary image A by a pixel p shifts the origin of A to p. If B is the structuring element then the dilation, A⊕B, and erosion, A⊖B, is the set of all shifts that satisfy the following:
Erosion followed by dilation creates a morphological opening operation and is defined as:
Dilation followed by erosion creates a morphological closing operation and is defined as:
After using the morphological opening and closing operation for the threshold images all noises are eliminated from the ROI image.
2.2.3.4 CCA or blob labeling
The character regions in a segmented LP image after morphological operations are grouped into a connected component and we used blob labeling or connected component analysis (CCA) to detect the connected regions in a binary segmented LP image [1]. The procedure for blob labeling or CCA is defined as described below.
Suppose that A is a binary image and that:
where, either u=0 or u=1. The pixel (x,y) is connected to the pixel (x′,y′) with respect to value u if there is a sequence of pixels (x,y)=(x0,y0),(x1,y1),…,(xn,yn)= (x′,y′) in which A(xi,yi)=u, i=0,…,n and (xi,yi) neighbors (xi-1,yi-1) for every i=0,…,n. The sequence of pixels (x0,y0),…,(xn,yn) forms a connected path from (x,y) to (x′,y′). A connected component of value u is a set of pixels C, each having value u, and is such that every pair of pixels in the set are connected with respect to u. Fig. 17(a) shows a binary segmented LP image with connected components of 1’s, and these components are actually connected with respect to the four neighborhood definition [27].
The result of (a) blob labeling and (b) character extraction.
2.2.3.5 Character extraction
After using the CCA, we were able to find the connected component as a character image and the 2-D bounding box bound each component. Hence, we were able to obtain the character region, as shown in Fig. 17(b), and save it for LPCR processing step.
2.3 License Plate Character Recognition (LPCR)
LPCR is the most significant and crucial step of the LPR system. The procedure of the LPCR is to identify the characteristics of the character from the input LP image. After the LPCS stage, normalized the extracted character images are to recognize extracted characters through a robust classifier, leading to the final output of the LPCR system.
2.3.1 Input extracted character image
Input segmented or extracted character images from LPCS (in Subsection 2.2) and will do the next processing for LPCR.
2.3.2 Normalized character image
It is very difficult to deal with the exact size of character images. The performance of LPCR is affected by the different sizes of characters and so we had to make the character images the same size. The size of a trained character is 24×42 pixels (width×height). As such, we had to make our extracted character from LPCS the same size (24×42 pixels).
2.3.3 Train Korean and numerical character images
There are two types of characters are available in Korean LPs, Korean alphabetic (Hangul) characters and numerical characters. There are 48 Hangul characters and 10 numerical characters that are used for Korean LPs. The Hangul and numerical characters that are used for Korean LPs are presented in Table 1.
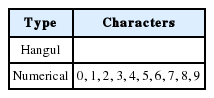
List of Hangul and numerical characters are used in Korean LP
In DRLP, the upper plate has the name of the city and where the vehicle was registered (see Fig. 13(b)) in Korea. In Korea, the Surface Transportation Bureau of the Ministry of Land, Infrastructure and Transport (MOCT) oversees the design and issuing of license plates (Korean:
 ) for motor vehicles. There are sixteen area offices that provide vehicle registration numbers in Korea, as listed in Table 2.

List of area offices are provided vehicle registration number in Korea
There are 42 common Hangul characters and 6 other characters that are specially used for provinces and cities in Korea. We extracted 1,000 different characters (Hangul and numerical) from Korean LP images. We normalized and binarized them to be the same size of extracted characters (24×42 pixels) and trained them for our LPCR. Fig. 20 shows some examples of Hangul and numerical character training sample images.
Some examples of Hangul and numerical character training samples images. (a) Numerical characters, (b) Korean alphabetic (Hangul) characters.
2.3.4 Matching and character recognition
The template-based method is used for matching with trained and extracted characters. Suppose the template of a trained character is g[x,y] and it needs to be matched with an extracted character image of f[x,y]. An obvious thing to do would be to place the template of a training character at a location in an image and to match its presence at that point by comparing the intensity values in the template of the training character with the corresponding values in the extracted character image. Since it is unusual for intensity values to match exactly, we needed a measure of dissimilarity between the intensity values of the template of a training character and the corresponding values of the extracted character image. Several measures can be defined as:
where R is the region of the template of a training character. The sum of the squared errors is the most common measure. In the case of template-based matching, this measure can be computed indirectly and the computational cost can be reduced. We can simplify:
Now, if we assume that f and g are fixed, then ∑fg gives a measure of mismatch. A reasonable strategy for obtaining all locations and instances of the template is to shift the template and use the match measure at every point in the image. Thus, for a m×n template of a train character, we compute:
where, k and l are the displacements with respect to the template of a train character in the extracted character image. This operation is called the cross-correlation between f and g. The main goal is to find the locations that are local maxima and are above a certain threshold value. However, a minor problem in the above computation was introduced when we assumed that f and g are constant. When applying this computation to images, the template g is constant, but the value of f will vary. The value of M will then depend on f, and, hence, will not give a correct indication of the match at different locations. This problem can be solved by using normalized cross-correlation. The match measure M then can be computed using:
It can be shown that M takes the maximum value for [x,y], at which g=cf. According to this method, the LP character is recognized. The results of matching and the recognition of extracted character images based on template are shown in Fig. 21.
The results of character recognition. (a) Original LP images, (b) results of character recognition.
2.4 Output LP Number and Save Vehicle Information
After the LP images are identified the information obtained from them will be important for future use. As such, we stored the vehicle LP information in a file and saved our information into a .txt file for SRLP and DRLP separately. Fig. 22 shows all of the vehicle LP information that was saved in a .txt file.
Some examples of saving the vehicle LP information in a .txt file. (a) SRLP original images, (b) SRLP .txt file, (c) DRLP original images, and (d) DRLP .txt file.
3. Experimental Results
The experiments for our proposed LPCS and LPCR methods were based on a PC with CPU 3.40-GHz Intel Core i7-2600 and 8.00GB of RAM and implemented the core algorithms in MATLAB R2013a. The database of 1,000 SRLP and 1,000 DRLP images with a resolution of 520×110 and 440×220 pixels was obtained from the success of our LPD from [1], and these images were captured at different times and weather conditions. The combination of different algorithms and proposed a global thresholding (GT) technique and also verified LP type with the prior knowledge were applied in our LPCS process. The cross-correlation matching algorithm was used for LPCR, which is very simple and fast. Our matching performance obtained significant results because our LPCS has high accuracy. Once the characters were extracted from a LP image then the recognition rate also had a high accuracy. Table 3 shows the performance comparison of different LPCS and LPCR techniques with our proposed methods. Our proposed methods show the best performance compared to other existing methods.
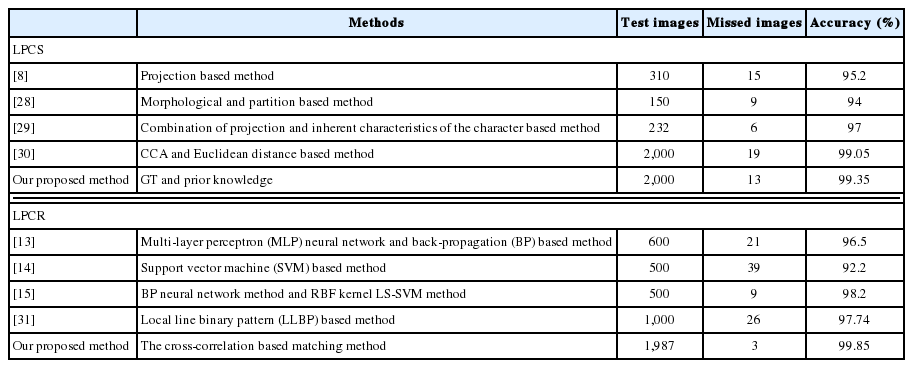
Performance comparison of different LPCS and LPCR techniques
4. Conclusions
In this paper, a combination of LPCS and LPCR systems has been proposed for Korean LP recognition in real-time processing even when the LP image quality is bad. The LPCS procedure presented in this paper that we combined with multiple image processing algorithms, GT, and prior knowledge of Korean LPs is especially useful for robustness and accuracy if the proposed system. We also used the cross-correlation matching algorithm based on the template of LP characters for the LPCR. The proposed LPCS and LPCR methods achieved 99.35% and 99.85% accuracy, which is significantly more efficient than other existing methods.
The result of vertical edge-emphasizing. (a) LP images after visibility restoration, (b) LP images after vertical edge-emphasizing.
The result of 2-D order-statistic filtering. (a) LP images after vertical edge-emphasizing, (b) LP images after 2-D order statistic filtering.
The result of ROI images after morphological operation. (a) ROI images after Otsu thresholding, (b) ROI images after morphological operation.

The procedure of proposed LPCR.
Normalized character image. (a) before normalization, and (b) after normalization.
Acknowledgement
This research was supported by the Basic Science Research Program of the National Research Foundation of Korea (NRF) that is funded by the Ministry of Education (NRF-2013R1A1A2060663).
References
Biography
Md. Mostafa Kamal Sarker http://orcid.org/0000-0002-8715-4234

He received his B.S. degree from Shahjalal University of Science and Technology, Sylhet, Bangladesh, in 2009, and his M.S. degree from Chonbuk National University, Jeonju, Korea, in 2013. He is currently doing research to obtain his Ph.D. degree of Electronics Convergence Engineering at Wonkwang University, Iksan, Korea. His research interests include the areas of image processing and computer vision.
Moon Kyou Song http://orcid.org/0000-0002-6078-6557

He received the B.S., M.S., and Ph.D. degrees in Electronics Engineering from Korea University, Seoul, Korea, in 1988, 1990, and 1994, respectively. In 1994, he joined the faculty of Wonkwang University, Korea, where he is a Professor in Department of Electronic Convergence Engineering. He was an Invited Researcher with Electronic Telecommunications Research Institute (ETRI), Daejeon, Korea, from 1997 to 1998 and 2000 to 2001. He was a visiting professor with University of Victoria, BC, Canada, during 1999–2000 and Stanford University, CA, USA, during 2006–2007. He is a senior member, IEEE.

 )
) ), Gangwon (
 ), Chungbuk (
 ), Chungnam (
 ), Jeonbuk (
 ), Jeollanam (
 ), Gyeongbuk (
 ), Gyeongnam (
 ), Jeju (
 )
) )
) ), Daegu (
 ), Incheon (
 ), Gwangju (
 ), Daejeon (
 ), Ulsan (
 )
) )
) ) (capital)