Event Detection on Motion Activities Using a Dynamic Grid
Article information
Abstract
Event detection based on using features from a static grid can give poor results from the viewpoint of two main aspects: the position of the camera and the position of the event that is occurring in the scene. The former causes problems when training and test events are at different distances from the camera to the actual position of the event. The latter can be a source of problems when training events take place in any position in the scene, and the test events take place in a position different from the training events. Both issues degrade the accuracy of the static grid method. Therefore, this work proposes a method called a dynamic grid for event detection, which can tackle both aspects of the problem. In our experiment, we used the dynamic grid method to detect four types of event patterns: implosion, explosion, two-way, and one-way using a Multimedia Analysis and Discovery (MAD) pedestrian dataset. The experimental results show that the proposed method can detect the four types of event patterns with high accuracy. Additionally, the performance of the proposed method is better than the static grid method and the proposed method achieves higher accuracy than the previous method regarding the aforementioned aspects.
1. Introduction
The main objective of event detection is to monitor and detect events for the safety and security [1] of human life and property. This is achieved by using surveillance-based security [2,3]. A traditional surveillance system can detect events for security, but it has the limitations of human error associated with long monitoring times (fatigue), time consumption, and labor intensity [4]. Therefore, it would be advantageous if the events were automatically detected. Automatic detection can process events based on two main parts [5]: event indexing by using feature extraction and event classification. One important step is the extraction of features [6,7], which is used not only for the object detection and tracking step but also for the event classification part. In order to achieve strong point detection, good feature extraction is desirable [8,9]. This good extraction gives better results in high quality features, which directly relate to high detection accuracy [10]. The methods that are used to extract features for analysis can be broadly classified into two main groups: non-grid-based and grid-based methods.
The former is a method of extracting features within a frame/image without segmenting a frame/image. This non grid-based method yields results with coarse features. The latter is a method of extracting features by segmenting a frame/image into small subregions called “grids,” which are used to extract features in order to detect events. The grid-based method can narrow down the dimensions of the feature vector [11], which changes in relation to spatial information. The spatial information features that are extracted using the grid deal with the problem of a high number of dimensional vectors and computation complexity; all of which directly impact accuracy. However, the grid-based method has two key limitations: camera position dependency and the variable position of the event taking place in the scene. The former relates to features extracted from different distances of training and test events between the position of the camera and the position of the event. The latter relates to the position of the training event, which can take place at any position on the screen, while the position of the test event may happen in a different position. Both key problems degrade detection accuracy.
Therefore, the dynamic grid method is proposed to robustly detect event patterns with regards to camera position dependency and the variable position of the event that is taking place. Regarding the experimental results for the position of the camera, the static grid and dynamic grid methods achieve detection accuracies of 58.00% and 78.00%, respectively. For the position of the event taking place, the static grid and dynamic grid methods result in detection accuracies of 55.00% and 75.00%, respectively.
This paper is organized as follows. Section 2 concerns related works on event detection based on a technique used to extract features and to then use those features to detect events. Section 3 describes the event patterns. Section 4 presents the proposed conceptual framework as well as the proposed algorithm. Section 5 shows the experimental results, and conclusions are provided in Section 6.
2. Related Works
This section presents research related to a technique used to extract a set of features for the detection of events and shares the details from other research on this topic. An event is defined as the occurrence of a specific action performed by a subject in a particular place during a particular time frame [12]. Events are detected for the purpose of security for two key reasons [13–15]: warning of known threatening events [14,15] and searching for events of interest after the event has taken place. Automatic event detection is broadly clustered into two types: event detection based on the analysis of features from a frame without segmentation, called a “non-grid,” and event detection by the analysis of features from a frame that is segmented into a small region, called a “grid.” The non-grid-based method [16,17] can detect events by using a set of features extracted from a frame that is not segmented, while the grid-based method can detect events by using a feature extracted from the frame, which is segmented into small regions based on a pre-defined size.
Saykol et al. [18] proposed a motion appearance mask with a grid size of 8×8 to extract the features from a keyframe. The motion appearance mask could label the motion as four types of simple events: join, split, move, and stop. The result after using the proposed mask is a sequence of keyframe labels, which are used as the input for the finite state machine to classify the event into three types: crossover, deposit, and pickup. The challenging aspect of the work is the selection of the grid size, which is a crucial requirement for effectively representing the motion.
Zhang et al. [19] presented a method to detect abnormal behavior in a crowd by using two key features: moving position and direction. Both features, which are extracted from the scene divided into an 18×12 grid, are fed into a neural network in order to detect four types of abnormal events: stampede, fall, panic, and fight. This work includes the crucial point for the size of the space-time feature, which balances the descriptive capability and complexity of the model.
Wang et al. [20] introduced a method to detect a gathering event by using a moving region as a feature. The proposed method divides a video scene into nine blocks (groups of cells), and it is able to extract the feature from all blocks. After that, the sets of features are fed into a hidden Markov model in order to detect the gathering event. Wang and Wang [21] proposed a similar method to detect a gathering event. This proposed method also divides the video scene into nine blocks, but all of these blocks are used to extract a set of features used to detect the gathering event using a two-layer hidden Markov model.
Wang and Miao [22] presented a method to detect abnormal behavior automatically and proposed a 3D grid structure to model the motion patterns by dividing the video frame into a 20×15 grid size. For each block, the motion is extracted and represented by a motion vector. The motion vectors from all blocks are used to generate a histogram of motion vectors, which is then used to identify abnormal behavior. The important factor affecting detection accuracy is the position of the camera. Moving people are close to or far away from the position of the camera, which relates to the magnitude of the motion vectors and affects detection performance.
Reddy et al. [23] presented an anomaly detection technique by using three features: foreground speed, size, and texture, which are extracted from the grid cells for each frame. The detection results of the proposed method rely on the grid size. The grid size is considered an issue because the size that is used to detect anomaly events directly impacts the detection accuracy relating to image resolution, change of perspective, and angle of view. One research paper [24] proposed a framework for the detection and localization of crowd behavior based on optical flow by using a grid size of 24×24 for obtaining the features of magnitudes, positions, and directions, which were then used to detect and localize escape events. The detection performance of the proposed method heavily depends on the positions of the cameras; if the event is detected far from the position of the camera, the detected event will be downscaled.
From the exploration of previous research based on grid sizes and the methods of frame/scene segmentation, which are summarized in Table 1, it can be seen that all of them can detect events by extracting features from small subregions after frame/scene segmentation. However, event detection based on frame/scene segmentation provides low detection accuracy due to two main issues: camera position dependency and the variable positions of the event that is taking place. The former relates to training and test events where the camera is in a different position. This yields a result with low detection accuracy if the camera at the detection area is not installed in an appropriate position. The latter concerns the lack of ability to detect the variety of possible positions for the event that is taking place in the scene. If the training event takes place in the corner of the frame, the grid-based method cannot successfully detect an event that takes place in the middle of the frame. Therefore, both main issues directly affect the event detection performance using the grid-based method.

Event detection from previous research
3. Event Patterns
This section shows the event patterns of interest in our work and provides the definitions and key characteristics of event patterns. Although there are several types of event patterns in a real situation, event patterns can be grouped into four main types: implosion, explosion, two-way, and one-way. Therefore, this research focuses on these four event patterns, as shown in Fig. 1.

Types of event patterns.
Fig. 1 shows the four event patterns, namely implosion, explosion, two-way, and one-way. Each pattern is modeled based on a directed graph as shown below.
Given DGA, DGB, DGC, and DGD are directed graphs defined, as shown in Eqs. (1)–(4).
All event patterns, implosion, explosion, two-way, and one-way, are modeled based on directed graphs, as shown in Eqs. (5)–(8), respectively.
The four event patterns that are modeled based on directed graphs are depicted in Fig. 2. The explosion pattern contains a lot of motion, with people moving from one point in various directions [8,25,26], as demonstrated in Fig. 2(a). The implosion pattern is defined as events that move from any direction towards a position at a certain destination [17,27], as shown in Fig. 2(b). Two-way has two dominant motions [28], some people move in a forward direction while others move in the opposite direction [26,29], as shown in Fig. 2(c). One-way has significant motion in only one direction [30], as depicted in Fig. 2(d).
Event patterns: (a) explosion, (b) implosion, (c) two-way, and (d) one-way.
4. Proposed Framework
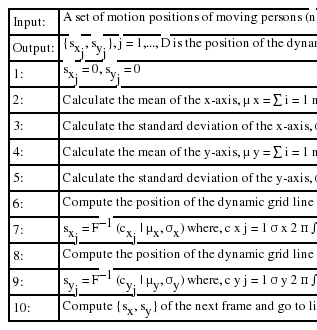
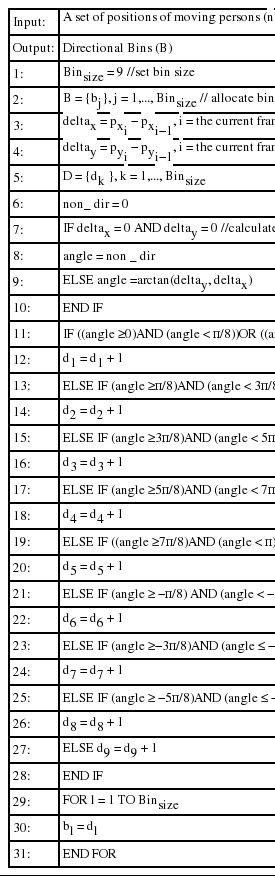
Fig. 3 shows the proposed framework for event detection, which is composed of two major parts: training and classification. The details of both parts are depicted in Fig. 3. The main objective of the training part is to generate a reference model that is used to classify the events in the classification part. The training part has three important steps: feature extraction, feature vector construction, and event model generation. The feature extraction step provides results with two significant features: frequency and direction. The former is acquired by using the dynamic grid proposed in this research to tackle the problems of the position in which the event takes place and the position of the camera, as shown in Algorithm 1. The latter is taken from the histogram bin, as shown in Algorithm 2. In the next step, both frequency and direction features are used to construct a set of feature vectors. Finally, the feature vector is used by the support vector machine to generate the event model that is used in the classification part.

A framework of event detection based on a dynamic grid.
Dynamic grid
Direction histogram bins
The main objective of the classification part is to classify the four event patterns. During classification, the unknown feature vector and event model are used to detect the event patterns.
5. Experiments
The experiments were conducted using two features, frequency and direction, which were obtained based on the dynamic grid and histogram bin, respectively. The experiments were composed of two parts: event detection based on the dynamic grid and a comparison of the results. The main objective of the experiments was to verify that the dynamic grid can be used to detect events and can tackle the two major problems related to the position of the camera and the position of the event taking place.
5.1 Dataset
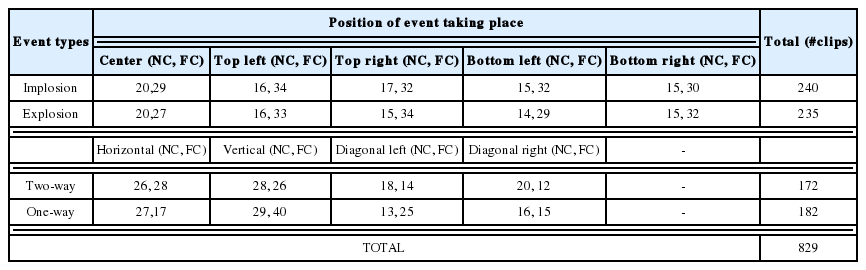
Our experiment is based on the Multimedia Analysis and Discovery (MAD) pedestrian dataset [31]. It is comprised of four major event patterns: implosion, explosion, two-way, and one-way, as shown in Table 2. There are five positions for an event taking place within a scene for implosion and explosion patterns: center, top left, top right, bottom left, and bottom right. There are four positions for an event taking place for both two-way and one-way patterns: horizontal, vertical, diagonal left, and diagonal right. In the second column of the table, NC and FC stand for the positions of the event that took place, which are close to and far from the position of the camera, respectively. For implosion patterns that occur in the center of the scene, there are 20 and 29 clips for close to the camera and far from the camera, respectively.
Details of the dataset
5.2 Performance Evaluation
To evaluate the performance of the proposed method, we used detection accuracy as well as recall and precision. Detection accuracy is defined as the percentage of correctly detected events over the entire set of instances. Let TP denote true positive, which is defined as the number of instances correctly detected from a given test set, while TN represents true negative. Let FP represent false positive, which is defined as the number of instances that are incorrectly detected from a given test set, while FN denotes false negative. Therefore, Recall = TP/(TP + FN ) and Precision = TP/(TP + FP ).
5.3 Experimental Results
For the implementation of the system, the experiments were run on a Windows2008 system with a 16-core, 2.4 GHz Intel processor, and 96 GB of memory. The experiments were tested on MATLAB 2009b, which includes an image processing toolbox. In the experiment, we used two features, the frequency from the dynamic grid and the direction from the histogram bin, to identify four event patterns based on the assumption that the dynamic grid-based features can work with robustness regarding two key aspects of the position of the camera and the position of the event taking place.
The average accuracy, recall, and precision of the test sets were obtained for the performance measurement. According to the two main aspects of interest in our experiments, we varied the grid sizes used to detect the four event patterns using the dynamic grid in order to study whether the grid size would affect detection accuracy regarding the two aspects. We also compared the results of the event detection using the dynamic grid-based method and the previous algorithm.
5.3.1 Results from the dynamic grid-based method
During the experimentation, the proposed method that used a dynamic grid, was tested to identify the four major event patterns. In training and testing our detection method, the experiments employed the leave-one-out cross-validation process, wherein the data was split into two sets in which one set was used for training and the other for testing. The dynamic grid method was compared to the static grid method. The experiments were conducted with regards to two major aspects: the position of the camera and the position of the event taking place. The detection results for both aspects are described as follows.
5.3.1.1 Results for the position of camera
In the experiment relating to the position of the camera, the data used to classify the event patterns regarding the position of the camera included two distances: near and far. For each distance used in the test that used the dynamic grid-based method, the sizes of the grid were varied (3×3, 5×5, 7×7, 9×9, and 11×11). In our experiment, if the training and test events had the same distance between the position of the camera installation and position of event scene, the training and test events were tested using the same distance. However, if the training and test events had a different distance between the position of the camera installation and the position of the event scene, the training and test events were tested with different distances. The results are based on the measurements of the detection accuracy, recall, and precision of the four patterns, as shown in Table 3 and Figs. 4–7.
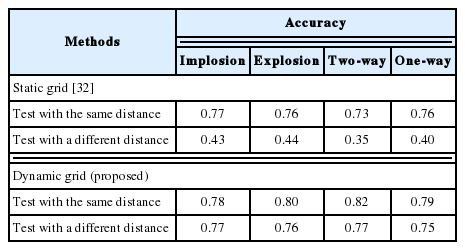
Detection accuracy for position of camera

Detection results for the implosion pattern.
Detection results for the explosion pattern.

Detection results for the two-way pattern.
Detection results for the one-way pattern.
Table 3 shows the detection accuracy for four event patterns based on the dynamic grid (proposed) and static grid [32] methods. The static grid method was able to detect the four event patterns with a high accuracy if the training and test data had the same distance between the position of the camera installation and the position of the event scene, but the static grid method provided results with poor accuracy when the training and test data had a different distance between the position of the camera and the event scene.
For the results from the dynamic grid method, although the distance between the position of the camera and position of the event scene had a different distance in the training and test set, event detection with the dynamic grid method provided results with a high accuracy. This implies that the dynamic grid method is robust regarding the distance between the position of the camera installation and position of the event scene.
Figs. 4–7 show the detection results based on the recall and precision of the four event patterns, implosion, explosion, two-way, and one-way, respectively. The static grid method gave better detection results with a high recall and precision when the training and test events had the same distance between the position of the camera installation and position of the event scene. However, this method provided poor results with regards to recall and precision when the events in both the training and test set had different distances.
The results of the dynamic grid method, including both test cases, and the results of the static grid in the case of testing with the same distance, produced insignificantly different recall and precision. This implies that the dynamic grid method can detect the four event patterns with higher robustness ability with regards to the variation of the distance between the position of the camera installation and the position of the event scene.
5.3.1.2 Results for the position of the event
For the experiment regarding the aspect of the position of the event occurring in the scene, the data for the four patterns included the possibility of the event taking place in various positions within a frame or a scene. For explosion and implosion patterns, both event patterns can take place in five positions: center, top-right, top-left, bottom-left, and bottom-right. For two-way and one-way patterns, both event patterns are possible for either pattern to move in the horizontal, vertical, diagonal left and diagonal right directions. In the experiments for both static and dynamic grids, the grid size was varied for each event pattern for both methods (3×3, 5×5, 7×7, 9×9, and 11×11). For this experiment, if both training and test events had a similar position, the test was done using the same position of the event, while if the training event took place in any position in the scene and the test event used a different position of the event taking place. The results for this aspect regarding the detection of the four patterns are based on the detection accuracy, recall, and precision, as shown in Table 4 and Figs. 8–11.
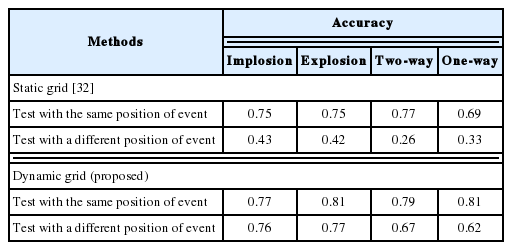
Detection accuracy for position of event
Detection results for the implosion pattern.

Detection results for the explosion pattern.

Detection results for the two-way pattern.
Detection results for the one-way pattern.
Table 4 shows the detection results of the four patterns from the proposed dynamic grid and the static grid methods. The static grid method could detect four event patterns with a high accuracy if the training and test events have the same position, but the static grid has the limitation that it gave results with poor accuracy when the event used to train the model and the test event used for detection took place in a different position. This implies that if both the training and test events have different positions, the accuracy is degraded.
The dynamic grid gave detection results with a high accuracy in two cases: when the training and test events took place in the same position in the scene and when the training and test events occurred in a different position in the scene. The results of the dynamic grid from both cases were not significantly different, which means that it is more accurate than the static grid method when the training and test events take place in different positions in the scene. This implies that the dynamic grid method outperforms the static method in its robustness ability regarding the position of the event taking place.
Figs. 8–11 illustrate the detection results based on recall and precision for the four event patterns, implosion, explosion, two-way, and one-way, respectively, in regards to the static grid and dynamic grid methods. The static grid method, in the case of training and test events taking place in the same position in the scene, had better recall and precision than the static grid method when training and test events had a different position, and for the detection of all types of patterns. This implies that the static grid method has limitations with regards to the aspect of the different positions of the event taking place, which means that it can result in a degraded performance.
The dynamic grid method, including both cases of testing with the same position and testing with a different position of the event, provided better recall and precision than the static grid method in the case of testing with a different distance. This implies that the dynamic grid method is more robust than the static grid method when events in training and testing have different positions in the scene.
5.3.2 Comparison results
To evaluate the performance of the proposed method, the dynamic grid was tested for the detection of event patterns regarding the problems that arise in the relationship between the two key aspects: the position of the camera and the position of the event. In the experiment, we evaluated the performance of the dynamic grid method compared with the previous method [18] by using five-fold, five-times cross-validation, in which the dataset was divided into five sets. One set was used for testing and the other four sets were used for training. The experiments were tested with five repetitions of the five sets used for training.
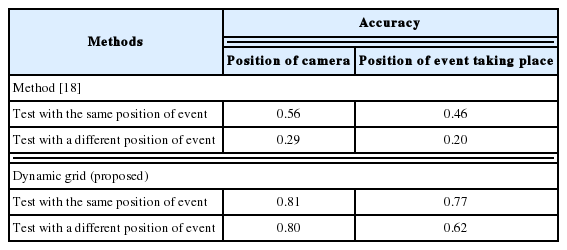
For the performance comparison of event detection, the dynamic grid method was compared with the previous method [18] based on the assumption that event types that were used for comparison against should share important characteristics of motion. Furthermore, the same types of events sharing the main characteristics of motion may be labeled differently in other research. In the results comparison, the proposed method was compared to the past research [18] based on using the two-way event pattern. The detection accuracy, recall, and precision were measured for the performance evaluation of the comparison results and based on the two major aspects the comparison results are shown in Table 5, Figs. 12 and 13.
Comparison results based on detection accuracy
Detection results for position of camera.

Detection results for position of event.
Table 5 shows the comparison results of the dynamic grid method and the previous research [18]. As shown in Table 5, the method in [18] could detect events with low accuracy when training and test data had the same distance between the position of the camera and the event scene and the same position for the event taking place in the frame. Also, the method in [18] provided detection results with a very low accuracy when the training and test events had different distances between the position of the camera and the event scene and different positions for the event taking place.
The dynamic grid method yielded results with a high accuracy for both the same and different positions of the camera and positions of the event. This implies that the dynamic grid method can detect events with a high accuracy, independent of the problems arising from the position of camera and the position of the event taking place.
Fig. 12 illustrates the comparison results regarding the aspect of the position of the camera based on the recall and precision of the dynamic grid method and the previous research [18]. The dynamic grid method outperforms the previous research [18] in tests with the same distance and tests with different distances. It can be concluded that the dynamic grid method can detect events with robustness, even in regards to the problem of camera position dependency.
Fig. 13 shows the comparison results with regards to the aspect of the position of the event taking place for the dynamic grid method and the previous research [18]. The dynamic grid provided higher recall and precision when tested with both the same and different positions of the event taking place compared to previous research [18]. In summary, the dynamic grid method is unaffected by the position of the event taking place in the frame.
6. Conclusion
This work proposes a method for event detection by using the frequency feature from a dynamic grid and the direction features from the histogram bins. The proposed method can detect four events, namely explosion, implosion, two-way, and one-way. The proposed method can detect events independently of the problems arising from the position of the camera and the position of the event taking place. Both of these key issues can affect and degrade the performance of the static grid method. From the experimental results, event detection based on a dynamic grid provides more accurate results than detection based on a static grid, for which the accuracy will decrease due to two key issues: the position of the camera and the position of the event taking place. It can be concluded that the dynamic grid method can detect event patterns in spite of the problems caused by these two key issues, and it can also be used to enhance the performance of the static grid method. Moreover, the dynamic grid method outperforms the previous research with regards to the detection of event patterns concerning these two key issues.
For further research, an adaptive grid-based model could be created for the detection of several other interesting event patterns or more than two event patterns occurring at the same time in the scene, which is a challenging event pattern to detect.
Acknowledgement
This research is partially supported by the Kasetsart University Research and Development Institute.
References
Biography
Jitdumrong Preechasuk http://orcid.org/0000-0002-2050-6389
He is a Ph.D. candidate of Computer Engineering, Kasetsart University. He obtained his B.Sc. in Computer Science from Silpakorn University in 1997 and M.Sc. in Computer Science from Mahidol University in 2002. His research interests include pattern recognition, multimedia content analysis and speech processing.

Punpiti Piamsa-nga http://orcid.org/0000-0001-9730-3005
He received his B.Eng. and M.Eng. in Electrical Engineering from Kasetsart University in 1989 and 1993, respectively and he obtained his D.Sc. in Computer Engineering from George Washington University in 1999. Currently, he is an associate professor of Department of Computer Engineering, Faculty of Engineering, Kasetsart University, Thailand. His research interest is pattern recognition and multimedia processing.
