Analysis of Semantic Relations Between Multimodal Medical Images Based on Coronary Anatomy for Acute Myocardial Infarction
Article information
Abstract
Acute myocardial infarction (AMI) is one of the three emergency diseases that require urgent diagnosis and treatment in the golden hour. It is important to identify the status of the coronary artery in AMI due to the nature of disease. Therefore, multi-modal medical images, which can effectively show the status of the coronary artery, have been widely used to diagnose AMI. However, the legacy system has provided multimodal medical images with flat and unstructured data. It has a lack of semantic information between multimodal images, which are distributed and stored individually. If we can see the status of the coronary artery all at once by integrating the core information extracted from multi-modal medical images, the time for diagnosis and treatment will be reduced. In this paper, we analyze semantic relations between multi-modal medical images based on coronary anatomy for AMI. First, we selected a coronary arteriogram, coronary angiography, and echocardiography as the representative medical images for AMI and extracted semantic features from them, respectively. We then analyzed the semantic relations between them and defined the convergence data model for AMI. As a result, we show that the data model can present core information from multi-modal medical images and enable to diagnose through the united view of AMI intuitively.
1. Introduction
Acute myocardial infarction (AMI) is one of the three emergency diseases where occlusion or stenosis occurs in the coronary artery, forming blood plaque in the artery. Currently, the number of patients has been increasing and many studies have been done in various fields in order to improve the quality of medical services. In IT fields, the data mining studies, analyzing medical data, finding the meaningful things, and predicting risk factors have been actively performed. Nowadays, there are a lot of topics in this field, such as extracting and analyzing the risk factor of a disease from the medical data of heart disease patients [1,2], predicting or diagnosing cardiac disease [3], analyzing and extracting the parameter of the P-wave using the correlation method in an electrocardiogram [4], data mining approach for coronary artery disease screening [5], and so on. However, the risk factor extracted from the medical data takes a lot of time to be used as a medical indicator in medically inferring or predicting the disease and it has a big limitation in validating the effectiveness. For this reason, a lot of medical experts have said that it is important in the medical field to effectively provide core information on medical data at one time rather than to infer or predict the meaningful factor on medical data. Particularly, the medical image is the most significant data among the medical data related to AMI, because the doctor should identify the status of an AMI patient’s coronary artery. In this paper, to effectively provide information on medical images for AMI, we propose the semantic based analysis and convergence data model between multimodal medical images.
Because the medical image is big data, it is separated from systems, such as the electronic medical record (EMR) system where the general medical data of patients are stored or the order communication system (OCS) for transmitting the medical data. In order to manage and process the medical image data, there is the system known as picture archiving and communication system (PACS), which has been designated as an international standard. A number of software tools for processing medical images have been developed based on PACS. In addition, it has been studied on analyzing or processing medical images at a low level [6,7], transmitting or exchanging the file in PACS [8,9]. However, most of the studies on PACS have only focused on processing and transmitting the medical images. So, they have the limitation of providing semantic information for medical images. Lately, the work on cardiac PACS, which reflects the distinctiveness of cardiac disease, has been studied. However it has only focused on the quantitative analysis of transmitting, rather than the semantic-based data convergence of medical images [10–13]. It has a big limitation in being able to provide the medical information effectively. For this, a structural data model should be required by semantic-based analysis of medical images rather than a flat data structure in the existing system, as shown in Fig. 1(a). In this paper, we analyze the relation between multimodal medical images for AMI-diseases by extracting semantic features that are utilized in the real medical field. Fig. 1 shows the changes made to the system through the semantic convergence of medical images for AMI. Fig. 1(a) represents the existing medical image file system and Fig. 1(b) is the final target system by building the semantic relations. As shown in Fig. 1, there are some problems in the legacy system.

System changes through semantic convergence of medical images related to acute myocardial infarction. (a) The existing medical image file system. (b) Semantic-based medical image file system.
PACS=picture archiving and communication system.
First, in the legacy system, shown in Fig. 1(a), it is difficult to identify the existence of the image data required for a patient’s disease all at once. For example, additional steps, like opening the image file one by one, are required to identify the existence of appropriate image data, because all data is listed with classification by general metadata (identification number, image name, date, and so on). In the case of AMI, it is important to identify the status of the coronary artery for fast treatment and diagnosis. As shown in Fig. 1(b), if it is possible to construct the semantic-relations based on coronary anatomy, we can intuitively identify the existence of image data and reduce the additional work like opening the file one by one. Here, we define ‘semantic relations’ as the embedded and shared characteristics between multi-modal images on the coronary anatomy, rather than just data expression, by using a representative picture-based description.
Second, the existing management system deals with images as a file unit. It also classifies the images using formal data, such as ID, name, date, and so on. Therefore, it is difficult to classify based on importance according to the degree of coronary artery stenosis or information about blood vessels in regards to AMI. However, if it is able to construct the semantic data model, it can be possible to show the images according to their importance, critical position, and so on.
Third, most software tools have limitations because they are studied on a single modal medical image. However, there are various medical images for AMI, such as coronary angiography, echocardiogram, electrocardiogram, and computed tomography (CT). Recently, although studies on the registration of multi-modal medical images have been performed [14–16], they also have the limitation of being focused only on image processing rather than semantic-based data convergence.
In this paper, we propose the semantic-based convergence scheme of medical images, such as a coronary arteriogram, coronary angiography and echocardiography, as representative medical images for AMI. This paper is organized as follows: Section 2 discusses the related work, such as cardiac PACS, semantic feature extraction from medical images, and coronary artery anatomy. In Section 3, we propose the semantic feature extraction scheme from an individual medical image for AMI. In Section 4, we analyze the relations based on semantic features in Section 3 and unite all relations and features to build an AMI convergence data model. Section 5 concludes this paper.
2. Related Work
2.1 Cardiac PACS
The PACS is a state-of-the-art medical system that can help to diagnose and view medical images, such as X-rays, CTs, and MRIs, in real-time through the computer in clinics or wards via a network. PACS, which is mainly used in radiology, has been applied to more specialized functions in cardiology and is called cardiac PACS [10]. Since most cardiac diseases result in emergency situation due to nature of disease, it is necessary to provide rapid and urgent treatment in the golden hour. For this reason, a lot of medical institutions have developed cardiac PACS and it offers a number of services that are targeted for cardiology and cardiovascular centers. It can also be the solution to obtain, transfer, analyze, and confirm medical images, such as an echocardiogram, CT, or coronary angiography, generated from many kinds of equipment. For example, it can help to write the report only for cardiology by saving the result of diagnostic cardiac catheterization. Also, by connecting the network in PACS, the system has been developed to be able to view and read the medical images from several computers within the hospital. In recent years, the system, which can simply view the cardiac medical images in the doctor’s office, has been deployed in a number of hospitals due to an interlocking technique between the OCS and EMR system [17].
Nowadays, most of the works related to PACS are focused on techniques that analyze and process the medical image itself [6,7] or technology that can quickly transfer or exchange the medical image data stored in PACS [8,9]. However, it is important to effectively provide core information about the medical images. A number of software programs developed in recent years reflect the distinctiveness of each modality of the medical images. For example, the graphical report has been introduced for effectively providing core information [18]. The graphical features allow a physician to more easily understand a report, but a lot of the features have limitations that are focused on analyzing a single modal medical image. However, the medical images related to AMI are related based on the coronary anatomy. If it provides information about the coronary anatomy based on semantic-relations between multimodal medical images, it can be more effective.
In this work, we extracted the semantic features from each single modal medical image and analyzed the relation between the multimodal medical images based on coronary anatomy. To provide core information on medical images, it is first required to analyze the existing medical image data standards. As shown in [10], the existing metadata in medical images is designated as the standard in PACS, which is the minimum collection extracted from the DICOM standard. It can improve the interoperability in the transmission and processing of medical images and describe the basic medical image information as explained below.
Patient Information: the patient’s general information such as their name, birthday, sex, and so on.
Study Information: the information about the clinical study (i.e., study date, referring physician, and so on).
Image Information: the description of the general properties in medical images such as image ID number or image type (modality).
Equipment Information: the description of the equipment’s general properties (i.e., the manufacturer, institution, model number, and so on) that measure the medical image.
Series Information: the information for processing medical images.
However, if we analyze the individual image’s measured elements or measurement criteria, such as the measurement axis or imaging plane of each modal image, it will have additional information on each modal image. It can be added to the semantic features in the PACS standard. Therefore, in this paper, we tried to analyze each single modal image’s semantic metadata and used them as optional metadata along with the PACS metadata standard.
2.2 Semantic Feature Extraction from Medical Images
A medical image is captured by taking a tissue or organ of human body inside. It can be used to diagnose many diseases, so that’s why it has high clinical value as medical data. A lot of medical institutions have studied medical images for various purposes. The studies related to medical images are roughly divided into three fields: image processing for treatment/registration of medical images, image transferring for fast delivery, and image analyzing for building a data model based on semantic features (high layer) or processing features (low layer). In this paper, for the purpose of providing core information on medical images, we tried to focus on analyzing the medical images. To do so, it is essential to extract the semantic features from the medical images. Some research on semantic-based feature extraction from medical images has already been carried out. It proposes ontology-based image indexing [19], the ontology design of image representation by medical image mining [20], and meaningful data extraction from medical image annotations [21]. However, most of the research does not deal with structured and semantic features on medical images and cannot consider the relations between multi-modal images. In [22], to build distinctive ontology for cardiovascular disease, focuses on merging the ontologies designed by multi-language, but it does not deal with a disease’s semantic information. In recent years, there has been an effort to visualize the various facets based on an ontology that integrates bio-medical data [23], but it does not cover medical images data. Therefore, we have defined the specific medical semantic features that can be extracted from medical images and tried to analyze the connection between multimodal medical images. As such, we have suggested the convergence data model of multimodal medical images for AMI.
2.3 Coronary Artery Anatomy
The coronary artery is the organ that supplies oxygen and nutrients to the myocardium. It is an important organ because it can stop providing the elements that are necessary for metabolism due to the status of the coronary. In AMI, it is important to identify the status of the coronary artery, such as stenosis or the occlusion symptom and degree. To effectively provide the medical information for AMI, we have to analyze the coronary anatomy-based characteristics. As shown in Fig. 2, there are three types of coronary artery appearance: the right coronary artery dominant, left coronary artery dominant, and the balanced dominant [24]. It is called coronary dominance. The coronary artery segment distribution varies according to the coronary dominance. In addition, there are two methods for analyzing the coronary anatomy. One is to focus on segmenting the coronary artery and the other is to focus on dividing the coronary territory. First, in order to analyze the coronary artery, we must segment the coronary artery. This segmentation method has been widely used in the medical fields [25]. As shown in Fig. 3, the main artery is divided into two parts: the right coronary artery (RCA) and left coronary (LCA) artery. From these two main branching points, one artery can be roughly divided into three parts: proximal, mid, and distal. Most medical experts understand this notational system. In the case of a coronary angiography, the identified artery segments are varied according to the angle because a coronary angiography has an optimal angiographic viewing angle [26]. It follows the same segment notational system previously mentioned. Second, it is possible to analyze the coronary anatomy in the aspect of divided coronary territory. This method is widely used in echocardiography interpretation. As shown in Fig. 4, there is 17-segment model of coronary territory for interpreting a 2D mode echocardiogram [27]. The type of echocardiography is determined by combining the 17-segment and the territory. By analyzing these methods, which are used in the medical field, we can construct the coronary anatomy with its semantic features.
Three types of the coronary arteriogram according to coronary artery dominance. (a) Right dominant, (b) left dominant, and (c) balanced dominant.

The notational system of coronary artery segment.
The 17-segment model of coronary territory used in two-dimensional echocardiography.
3. Extracting Semantic Features from a Single Modal Medical Image
For the diagnosis and treatment for AMI, there are various types of medical images, such as echocardiogram, electrocardiography, and coronary angiography, which can be frequently used in medical fields. In this paper, we chose three modal medical images that are frequently used from among various medical images, as shown in Fig. 5. In this section, we show how we extracted semantic features from each single modal medical image.

Representative medical images related to acute myocardial infarction. (a) Coronary arteriogram, (b) coronary angiography, and (c) echocardiography.
3.1 Coronary Arteriogram
As can be seen in [18], it has introduced a graphical report to record the procedure information (cardiac catheterization) related to AMI by using the coronary arteriogram. The coronary arteriogram can provide intuitive information on coronary anatomy and is generally used to record medical information, as shown in Fig. 5(a). It depicts the coronary artery exited from the aortic root base, which supplies oxygen and nutrients to the myocardium. The key letters in coronary arteriogram are R, L, A, D, and C. They describe the atomic level artery segment, as shown in Fig. 6, and are the syntactic and explicit information. However, there is hidden information of the structure of the coronary artery. For example, the R series is included in the main segment of the RCA and the S series is in the septal segment of the left anterior descending branch. The semantic structure of the coronary artery is made by expert’s knowledge. As such, we called the structure above the atomic-level segment the ‘semantic-level segment’.
Coronary artery segmentation tree model.
A number of physicians utilize the coronary arteriogram to graphically denote the status of the coronary artery (stenosis or occlusion) using analog or digital annotation. For example, for segments such as C1 and D1, shown in Fig. 5(a), the physician filled the inside of the segments C1 and D1. This is known as the diagnosis information, which shows the position and the range of stenosis. In knowledge of the physician, this information is expanded from D1 to the LCA-LAD-branch-diagonal segment and from C1 to the LCA-LCx-main segment, as shown in Fig. 6. This is known as hidden knowledge. Consequently, the syntactic information that has an atomic-level can be expanded, as shown in Fig. 6, and it can be the semantic model of the coronary arteriogram.
Although the blood vessel image of a coronary arteriogram is different for each hospital, it has been widely used as it can share the core information of the coronary artery. Therefore, it can be a representative template for conveying the description of an AMI diagnosis, which is converged with various features that have been extracted from multimodal medical images. The syntactic and semantic features from a coronary arteriogram image are summarized as described below.
Coronary Artery Dominance: Looking at the coronary artery anatomically in the coronary arteriogram, the coronary artery can be divided into the two parts of the RCA and LCA, as shown in Fig. 3. Each patient differs slightly in coronary dominance [24]. However, most patients can be statistically represented by three cases, as shown in Fig. 2, and the coronary dominance can be used as the metadata of the coronary arteriogram. A patient’s coronary artery characteristics depend on the coronary dominance. As such, it is important to confirm the dominance and the characteristics of each patient. Here, we can define coronary dominance as metadata that can share the semantic category of the coronary arteriogram.
Coronary Artery Location: Anatomically, the RCA and LCA can be divided into segment units according to location of the coronary artery, as shown in Fig. 6. This coronary artery segment can represent the location of the coronary artery as the atomic-level syntactic features in coronary arteriogram. As shown in Fig. 6, the RCA is divided into the main segment and branch and the branch is divided into the acute marginal and tail branch. The LCA is also divided into LAD and LCx repeatedly. Here, we can obtain the syntactic features, such as the R, A, L, D, C, etc., blood vessels, at the atomic-level and the semantic features, such as the LCA-LAD-branch-diagonal vessel, D1.
-
Coronary Artery Lesion: The coronary arteriogram consists of not only the heart and coronary artery image (unstructured data), but also text annotation (semi-structured data) written in an analog or digital format. In addition to the semantic feature, the coronary artery dominance and location, and the diagnosis and treatment information extracted from text annotation can be the semantic features in the coronary arteriogram. The text annotation is written by a physician and is directly related to the disease. The semantic feature extracted from text annotation can be summarized as follows:
Lesion site: the location of the disease, which is marked by a physician. The position is expressed as a unit of atomic-level vessel segment information.
Disease symptom: the disease name (symptom), such as stenosis or occlusion, which describes the thrombus and clogging in the coronary artery.
Disease degree: the degree of the disease state, which can be expressed in a percentage unit, such as 30% luminal narrowing.
The corresponding coronary artery segments are varied in the three types of the coronary arteriogram, as shown in Table 1.
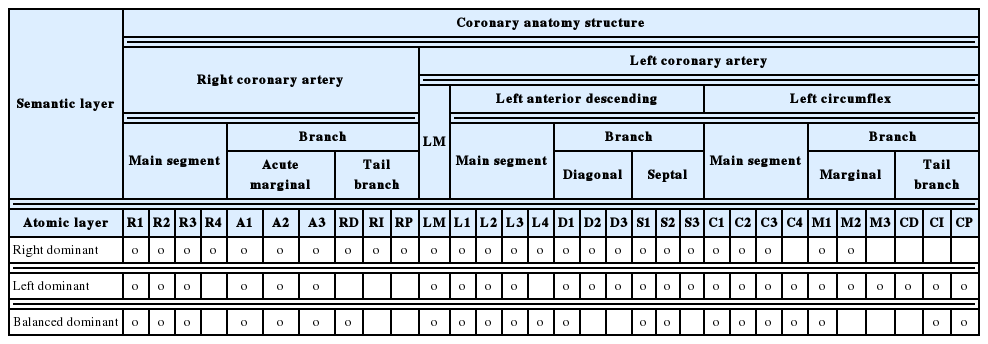
Coronary artery segment distribution according to the coronary dominance in coronary arteriogram
The semantic features extracted from the coronary arteriogram can be reorganized, as shown in Table 2. It is divided into three parts in a view of the type of data structure: unstructured data, semi-structured data, and structured data. The unstructured data includes the anatomical heart image, where there can be features such as coronary dominance and coronary location information. The semi-structured data means text or image annotation, which is the so-called coronary lesion information. Finally, the structured data includes general image metadata, such as patient basic information, referring physician, and image information.
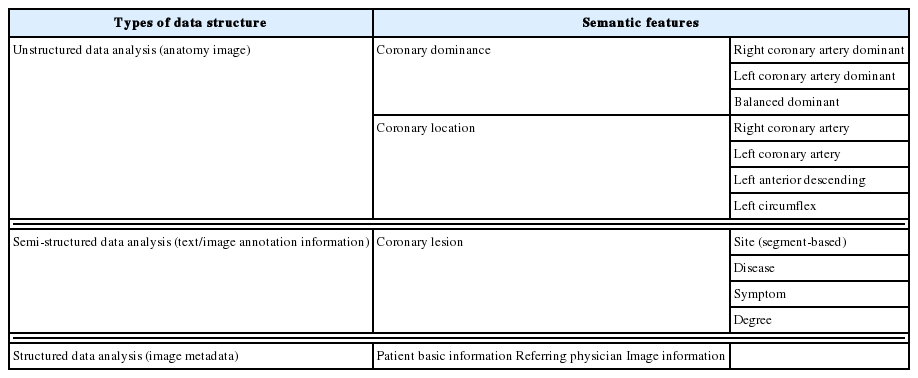
Semantic features extracted from coronary arteriogram
3.2 Coronary Angiography
Coronary angiography (CAG) is the medical image with a view to pass through the radiation (X-ray) after the administration of the contrast agent (drug) through a slim catheter to the blood vessel, as shown in Fig. 5(b). It is used to diagnose various vascular diseases. CAG is more important medical data in the case of where the oxygen and nutrition supply disorder, because it is able to view the coronary artery blockages. As shown in Fig. 5(b), CAG is a black-and-white image, and in CAG, the partition of the coronary artery where the contrast agents are administered is darker than the other blood vessels. It can focus on a specific section of a blood vessel and that is why it is useful for the diagnosis of AMI. To effectively provide core information from medical images that are related to AMI, it is required to analyze the semantic information in CAG. Similarly to a coronary arteriogram, syntactic and hidden knowledge are located in CAG, too. However, we define the semantic as meaningful information in diagnosing the disease, because CAG is unstructured data that is ambiguous for extracting semantic. For example, the explicit profile of the coronary artery includes thickness and tortuosity as syntactic information and the diagnosis of the disease is hidden knowledge of physician. Therefore, we extracted the indicators, such as thickness and tortuosity, as the semantic information. By analyzing the syntactic with hidden knowledge, the semantic features extracted from CAG are summarized as follows: coronary artery profile, disease profile, and measurement.
Coronary Artery Profile: For diagnosing AMI, physicians generally use the coronary artery profile in CAG images. By measuring the CAG, the physician can check the thickness, tortuosity, and dominance of the coronary artery as an indicator of the patient’s coronary status. Therefore, it can be the one of the semantic features extracted from unstructured data, CAG.
Coronary Disease Profile: CAG can show the coronary artery status and the partition information administered to contrast agents. Therefore, from the CAG, we can find the coronary artery state information associated with occlusion or stenosis and the state of the lesion site (symptom, degree). The lesion site is related to the coronary artery segment in Fig. 6 and can be marked to the coronary arteriogram in Fig. 5(a).
-
Image Measurement Information: As mentioned in Section 2.1, the existing metadata in medical images is designated as the standard in PACS, which is the minimum collection extracted from the DICOM standard. It has been widely used in medical image processing because it can improve the interoperability in transmission and the processing of medical images. However, in addition to the existing PACS standard metadata (patient, study, image, equipment and series information), it is necessary to add metadata—the measurement axis for CAG. It can be optional metadata in the PACS standard because it is only for CAG and the metadata is divided into two parts:
Rotation (longitudinal axis): is the longitudinal axis-plane based on the heart structure. It if divided into two parts (left anterior oblique [LAO], right anterior oblique [RAO] direction) according to the positive/negative degree.
Angulation (transverse axis): is the transverse axis-plane based on the structure of the heart. It is divided into two parts (cranial, caudal direction) according to the positive/negative degree.
In a view of a physician, a coronary artery segment can be analyzed as shown in Fig. 3 [25]. According to the degree based on the above heart axis, the coronary artery segment can be varied. In Radiology, the optimal angiographic view is presented as shown Table 3 [26]. It can be the semantic relation between the measurement degree values based on the above axis and coronary artery segment. For example, to view the segment of the RCA-distal, the optimal angiographic angle is 25° toward the LAO direction in the rotation axis and 25° toward the cranial direction in the angulation axis optimally (the error bound is from 15 to 50). By setting this angle, we can see the RCA-distal artery segment.

Semantic-based measurement relations in coronary angiography
We also reorganized those features into three parts: unstructured data, semi-structured data, and structured data. The unstructured data includes the coronary artery profile, such as tortuosity, thickness, and dominance, and the disease profile related to occlusion and stenosis. The semi-structured data means text or image annotation, where there can be an artery profile of interest, and the structured data includes general metadata. However, in the case of CAG, the image measurement axis can be added in addition to the PACS standard metadata. The semantic features extracted from CAG are summarized in Table 4.
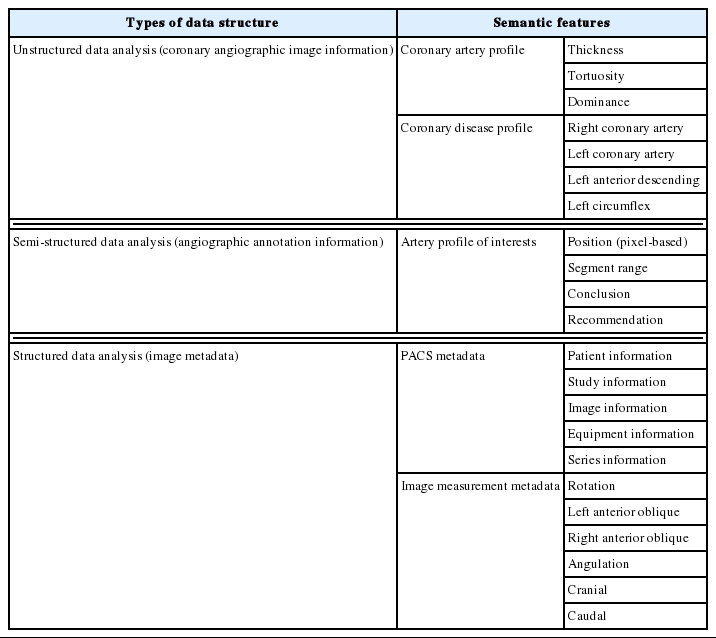
Semantic features extracted from coronary angiography
3.3 Echocardiography
Echocardiography is the essential medical image for the diagnosis of AMI. It is able to check the heart’s structural and functional abnormalities and can view all of the directional cutting sections of the heart and the aorta by using ultrasonic waves. It is a black-and-white image, as shown in Fig. 5(c), and it shows the features of the heart by considering the inside structure of the heart, such as major vessel diameters, surface based on measurement plane. By using the syntactic information, such as the heart measurement features, it is possible to analyze the heart function (diastolic/systolic) or valve function. To understand the function of the heart or the valve, it is necessary to obtain the hidden knowledge that can diagnose the functionality. Similarly to CAG, there are imaging planes in echocardiography, too. To capture the echocardiography, the operator has to select imaging planes, because the identified surfaces can be varied according to these planes. This can be the optional metadata of the echocardiography and can be added in the PACS standards. However, the imaging plane is divided based on the 17-segment coronary model, as shown in Fig. 4. Therefore, we tried to analyze the measurement types based on this 17-segment model and have proposed semantic features. The semantic features extracted from the echocardiography are divided into four parts: image measurement, coronary territory, heart structure, heart function.
Image Measurement Information: Echocardiography is the medical image that aids in diagnosing a heart abnormality by showing the heart structure based on the imaging plane, which is transmitted toward the outside of the heart by a transducer. In 2D echocardiography, there are two imaging planes [28] and it is divided into two large planes of apical and parasternal. According to these imaging planes, there are six types of images: 4 chamber, 2 chamber, long-axis, base, mid, and apex [29].
Image Measurement Information: Echocardiography is the medical image that aids in diagnosing a heart abnormality by showing the heart structure based on the imaging plane, which is transmitted toward the outside of the heart by a transducer. In 2D echocardiography, there are two imaging planes [28] and it is divided into two large planes of apical and parasternal. According to these imaging planes, there are six types of images: 4 chamber, 2 chamber, long-axis, base, mid, and apex [29].
Coronary Territory Profile: In echocardiography, the imaging plane is divided into a 17-segment model in detail [27]. The 17-segment model is distributed in each type of echocardiography. In other words, the combination of segment models can be the one echocardiography image. In order to analyze the semantic connection between the echocardiography and AMI, it is essential to map the 17-segment model of the coronary artery [30]. Therefore, the connection between the 17-segment model and coronary anatomy can be generated.
Structural Abnormality of the Heart: In echocardiography, a lot of echocardiographic values of the image elements associated with the heart structure (diameter, flow rate, and so on) are measured. There are two types of methods used for measuring an echocardiography (M-mode/Doppler). The elements in the echocardiography that were measured according to these methods are shown in Table 5.
Functional Abnormality of the Heart: We can identify the functional abnormality by the combining of the structural values of the heart. In CAG. We extracted semantic features, such as a coronary stenosis lesion. In echocardiography, it is also possible to see the functional state of the heart, such as its timely state (diastolic/systolic), valve function, and so on.
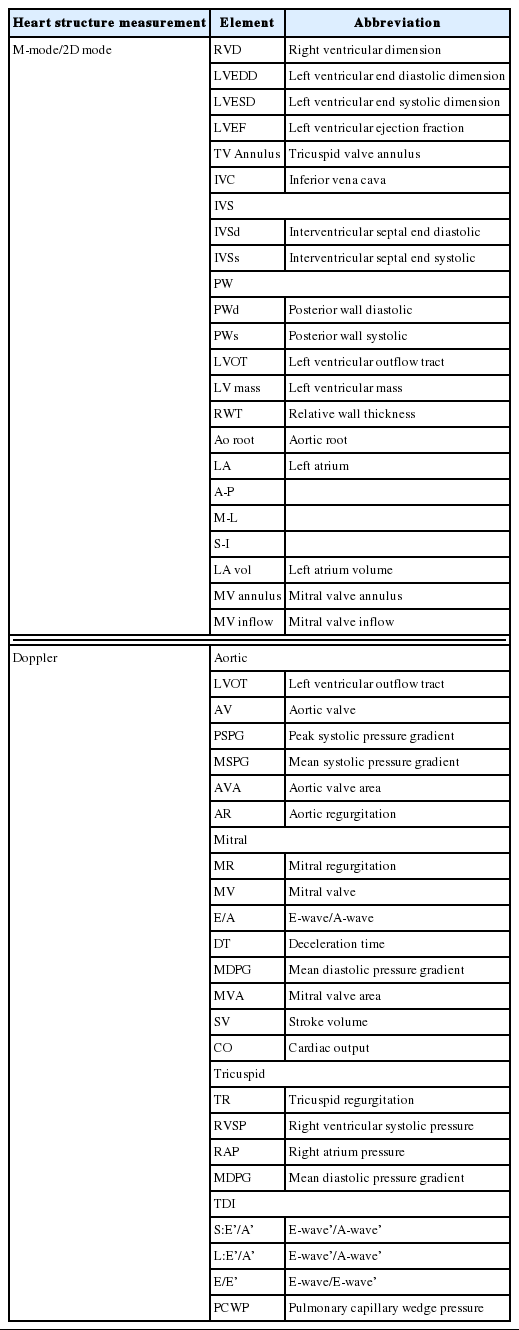
Measurement features of heart structure in echocardiography
Similar to a coronary arteriogram and CAG, the semantic features extracted from echocardiography can be shown as they are in Table 6. It is also divided into three parts: unstructured data (pure image information); semi-structured data (text/image annotation); and structured data, such as image metadata. In regards to semantic information in echocardiography, there can be features like heart structure, function, valve, disease information, and so on.
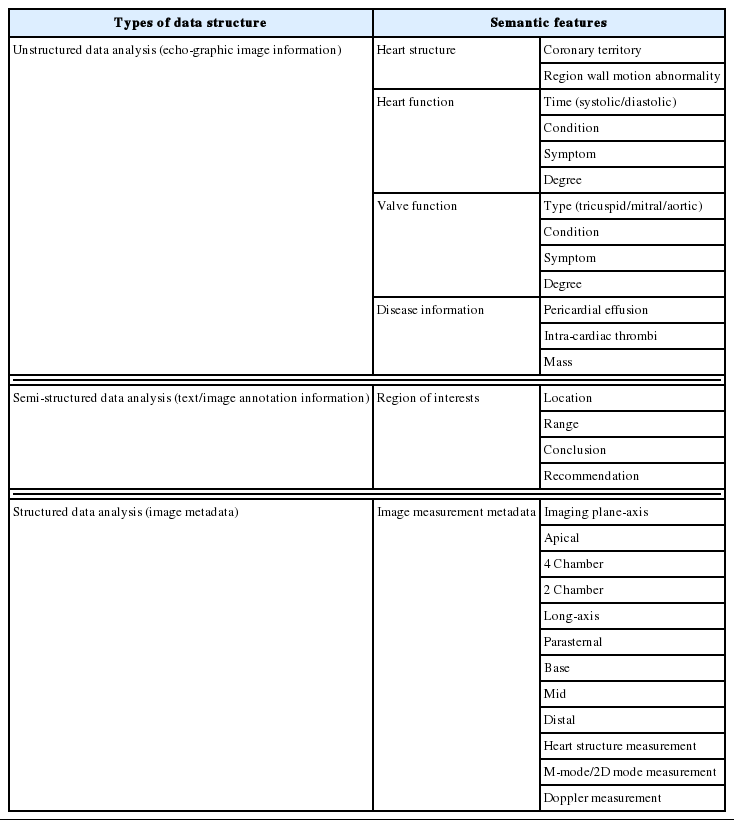
Semantic features extracted from echocardiography
4. Connection Analysis of Multimodal Medical Images
4.1 Semantic Connections between Medical Images
In this section, we analyzed the semantic connection between the multi-modal medical images related to AMI based on the extracted features of each medical image. Semantic connection means features used as a basis for diagnosis by combining features between multimodal images. In this paper, we focused on the features of three images (i.e., coronary arteriogram, CAG, and echocardiography) and the semantic relations are from ➀ to ➄ as follows: in Fig. 7(a), there are the semantic features extracted from the coronary arteriogram (coronary dominance, coronary artery location and lesion information). In Fig. 7(b), they are listed for CAG (coronary artery profile, abnormality and measurement information). In Fig. 7(c), the semantic features extracted from the echocardiography can be summarized (coronary territory, heart structure, heart function and measurement). Based on these semantic features of individual medical images, we defined the five relations between multimodal medical images as listed below.

Relation analysis between multi-modal medical images for acute myocardial infarction. (a) Coronary arteriogram, (b) coronary angiography, (c) echocardiography. RCA=right coronary artery, LCA=left coronary artery, LAD=left anterior descending, LCx=left circumflex, LAO=left anterior oblique, RAO=right anterior oblique.
➀ Coronary territory-artery segment relation (between b and g in Fig. 7): In a coronary arteriogram, we can acquire the segmentation analysis of the coronary artery. We can also see the 17-segment model that is based on the imaging plane in echocardiography. These two attributes have an anatomical relation in heart structure and the result is shown in Table 3.
➁ Semantic-based measurement information relation (between b and f and between g and j in Fig. 7): This is the inner relation in individual medical images. In the case of CAG, the blood vessels vary according to the angle based on the measurement axis (rotation and angulation). Also, in the case of echocardiography, the segment models can vary according to imaging plane.
➂ Coronary artery status relation (between c and d in Fig. 7): The coronary disease information that can be identified in CAG is the site and status of the lesion (symptom/degree). The lesion site and status information in the coronary artery are described in the coronary arteriogram.
➃ Angiographic coronary relation (between d and e in Fig. 7): In CAG, the coronary artery profile information (thickness, tortuosity) is the evidence of a coronary abnormality. Therefore, it has an angiographic coronary relation.
➄ Heart abnormality relation (between h and i in Fig. 7): Similarly to the angiographic coronary relation (➃), the heart structure profile information is the evidence of a heart abnormality in echocardiography. Therefore, it contains the heart abnormality relation.
There are five proposed relations in total and they need to be reorganized as a structured convergence data model. The convergence data model can be used as a service model for a fast search or the united view of multi-modal images for PACS, which we explain in detail in the next section.
4.2 Convergence Data Model based on Semantic Relations
Based on the semantic features and relations from the sections above, we suggest the convergence data model for multimodal medical images. The semantic features from the three medical images for AMI (coronary arteriogram, CAG, echocardiography), are composed of the data model, as shown in Table 7.
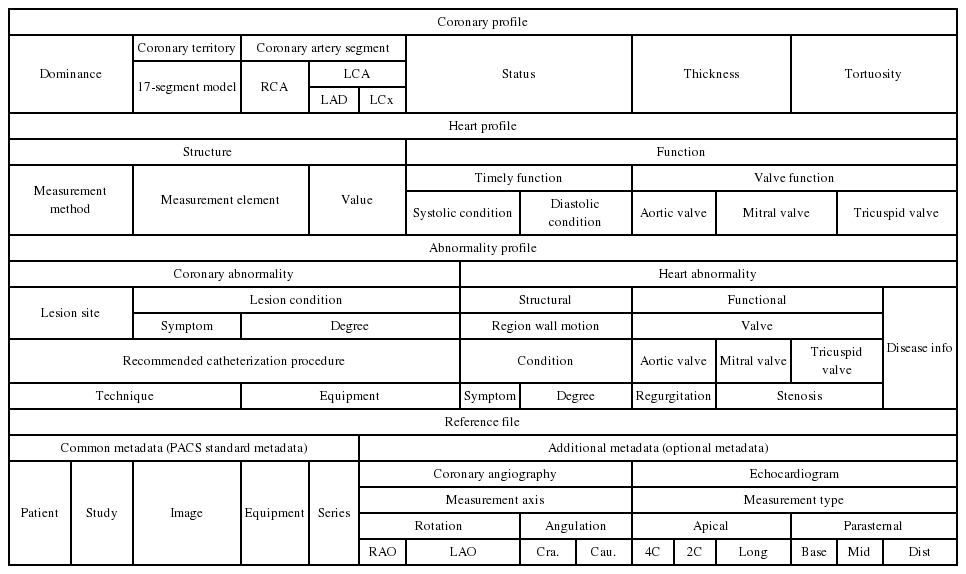
Convergence data model of multi-modal medical images for acute myocardial infarction
➀ Coronary Profile: AMI is a disease where there is occlusion or stenosis in the coronary artery. Therefore, as shown in Table 7, there is the property of coronary profile to represent the patient’s disease information (AMI). For example, there are the properties of the coronary artery such as dominance, status, thickness, and tortuosity. It also includes the coronary territory model and coronary artery segment.
➁ Heart Profile: It is important to identify the coronary artery status, as well as the heart status in AMI. Therefore, it is necessary to keep the section of the heart profile extracted from the echocardiography. For example, we can see the properties of the heart, such as its function and structure.
➂ Abnormality Profile: As a record of the patient’s disease record, it shows the property of abnormality. The type of abnormality is divided into two parts: the coronary artery and heart abnormality. Therefore, in this section, it is possible to identify the AMI patient’s medical issue. For example, we can see the lesion site, condition, and recommended catheterization procedures in a coronary abnormality. In a heart abnormality, it is possible to see the structural or functional abnormality of the heart, such as the region wall motion abnormality and valve function abnormality.
➃ Reference File: This is the actual reference file, such as CAG or echocardiography. There are two types of metadata: common and additional metadata. The PACS standard metadata exists as common metadata. In partial metadata, it is optional metadata for individual medical images. In the case of CAG, the measurement axis (rotation/angulation) can be added. Also, in the case of echocardiography, the image type can be added according to measurement axis (apical/parasternal).
5. Conclusion
In this paper, we proposed a convergence data model for effectively providing core information for AMI. First, we extracted the semantic features from medical images focused on AMI. Second, we suggested semantic relations between multimodal medical images based on the extracted semantic features. The semantic features and relations were structured by analyzing the domain knowledge on the AMI in depth, which can actually be used in the medical fields. Finally, we proposed the convergence data model for AMI by uniting the semantic features and relations. This model was built by uniting the information distributed in individual single-modal images and can effectively show the core information about AMI. In other words, it is possible to intuitively and promptly provide the core information on medical images for making an AMI diagnosis. In addition, it is also utilized as a knowledge-based data model for AMI. In future work, we’ll design a data convergence model as ontology for the diagnosis and treatment for AMI. Based on AMI ontology, we’ll also implement the AMI viewer, which can express semantic relations between multimodal images and show the core information about AMI hierarchically based on the coronary arteriogram.
Acknowledgement
This paper was conducted as part of the Info-Communications Broadcast Research and Development projects of Ministry of Science, ICT and Future Planning and the Institute for Information and Communication Technology Promotion (No. 14-824-10-023, Development of open ICT healing platform using personal health data).
References
Biography
Yeseul Park

She is in Master’s course in Department of Electrical and Computer Engineering at Ajou University, Suwon, Korea. She received B.S. degree in Electrical and Computer Engineering from Ajou University in 2015, respectively. Her research interests include Data Modeling for Bio-medical Images, Ontology and Embedded Software.
Meeyeon Lee

She is a lecture professor of the Department of Electrical and Computer Engineering at Ajou University, Korea. She received Ph.D. degree in Computer Science and Engineering from Ewha Womans University, Korea, in 2012. For 2012–2014, she was a post-doctoral researcher in Ubiquitous Convergence Research Institute (UCRi). She was a research assistant professor in Ajou University, Korea, for 2014–2015. Her research interests include ubiquitous computing, mobile computing, context-awareness, data modeling, bio-medical data modeling, and ontology.
Myung-Hee Kim

She is professor of the Department of Computer Engineering at Ewha Womans University, Korea, since 1987. She received M.S. degree in Department of Statistics and Calculation from Seoul National University in 1979. She also received D.S. degree in Electrical and Calculation from Gottingen University in 1986. Her current interests include Bio-Medical Images, Virtual Reality and Simulation.
Jung-Won Lee

She is an associate professor of the Department of Electrical and Computer Engineering at Ajou University, Korea, since 2006. For 2003–2006, she was the BK professor in Ewha Womans University. She received her Ph.D. degree in Computer Science Engineering from Ewha Womans University, Korea in 2003. She was a researcher of LG Electronics and did an internship in the IBM Almaden Research Center, USA. Her research interests include Mobile Context awareness, Ontology, Biomedical Data Modeling and Embedded and Software.