A Comprehensive Review of Emerging Computational Methods for Gene Identification
Article information
Abstract
Gene identification is at the center of genomic studies. Although the first phase of the Encyclopedia of DNA Elements (ENCODE) project has been claimed to be complete, the annotation of the functional elements is far from being so. Computational methods in gene identification continue to play important roles in this area and other relevant issues. So far, a lot of work has been performed on this area, and a plethora of computational methods and avenues have been developed. Many review papers have summarized these methods and other related work. However, most of them focus on the methodologies from a particular aspect or perspective. Different from these existing bodies of research, this paper aims to comprehensively summarize the mainstream computational methods in gene identification and tries to provide a short but concise technical reference for future studies. Moreover, this review sheds light on the emerging trends and cutting-edge techniques that are believed to be capable of leading the research on this field in the future.
1. Introduction
A DNA sequence determines an organism’s biological traits and indicates evolutionarily conserved functions of underlying genomic regions, which is hereby viewed as the blueprint of life. Finding and annotating the genes encoded in a DNA sequence is substantial work and is prioritized as the first task that is to be conducted after completing DNA sequencing [1]. The first phase of the Encyclopedia of DNA Elements (ENCODE) [2] project, which aims to delineate all of the functional elements encoded in human and other organisms’ genomes, has been said to be complete. However, rigorous examination and annotation of functional elements has only been completed for approximately 1% of human genomes, including important genome segments, such as defined coding and non-coding segments, and reproducible binding and splicing signatures [1,2].
It is clear that accurately and quickly annotating the sequenced genomes is significant for learning the biological and evolutionary relationship between genomes. However, with the advent of new sequencing technology, the pace of genome annotation and analysis is far behind the pace of genome sequencing. The fact that experimental annotation is time consuming drives the development of computational techniques for automatic genome annotation. From amongst all of the different annotation tasks, the computational identification of gene is central. Thus, in the next decade, the complete annotation of genes and their functional elements continues to be the primary aim targeted by scientists in this field [2].
The problem of uncertainty in gene annotation remains in individuals, cells, and tissues. According to conservative estimates, 3%–8% of human genomic bases are conserved under a purifying selection and are therefore thought of as functional. However, the actual percentage may be higher than these estimates as new protein-coding genes are continuously being found and reported, and many genes are expressed only in particular circumstances and specific tissues. For example, recent research [3] on the analysis of mass spectrometry data from K562 an GM12878 cell lines yielded 57 confidently-identified unique peptide sequences intergenic relative to the GENCODE annotation, which provides strong evidence that additional protein-coding genes are yet to be found. Additionally, extensive transcriptional overlapping between different genes demonstrates that potential protein-coding regions may be combined to produce transcripts from loci that are very far apart in linear genomic space [4]. These investigations challenge the present definition of a gene and illustrate that knowledge about them is still in the preliminary phase [5].
Despite these challenges, delineating the set of potential protein-coding regions remains the key step in genome analysis. This is due to the fact that the gene-finding problem is directly relevant to protein synthesis and the regulatory function of non-coding RNA, which is the core of all bioinformatics research. Therefore, it has attracted broad attention in the field of bioinformatics [4], and a plethora of computational methods and avenues have been developed to unveil the structures and functions of genes as well as regulatory non-coding RNAs.
Emerging high-throughput sequencing technologies provide dense and intense transcript data for scientists to study reference genomes and expose potential splicing sites, through which potential exon and intron structures are discovered. As such, a wealth of transcriptional activities in the eukaryotic genome has been reported since next generation sequencing (NGS) was invented [6]. It further demonstrates that current annotations in humans and other species are just a fraction of all of the transcriptional elements that actually exist.
According to conventional opinion, the gene prediction problem is approximately equivalent to protein-coding prediction, but it may also include the detection of other functional elements, such as non-coding or intergenic regions. The typical input data are DNA sequences and the expected output are typically labeled information for annotating protein-coding regions, RNA coding regions, non-coding regions, or other elements of interest, which depend on the exact purpose.
In prokaryotic organisms, protein-coding regions can usually be recognized in a contiguous sequence (open reading frame) without any interruption (intron). Some recent evidences have shown that the convention is often disordered by the frame shifts (insertions or deletions of nucleotide segments) [5], which lead to some issues in gene prediction. However, it is often thought that it is much easier to conduct gene prediction in the prokaryotic genome than in the eukaryotic genome because introns separate exons in eukaryotic genes and the splicing sites between the exon and intron are difficult to recognize due to the far distance (>100 bp) and the unidentified length. The boundary detection of genes relies on expert knowledge in biology on areas such as promoters, binding sites, and start/stop codons.
In the past decades, the methods for gene prediction problem were divided into three main categories: ab initio methods, comparative genomics, and hybrid methods. The first one primarily relies on: 1) statistical patterns extracted from accumulative protein coding database, 2) prior knowledge obtained in existing biological techniques, and 3) signal processing that takes advantage of the periodicity of amino acid codons [7]. Comparative genomics can accurately locate conserved coding exons by pair-wise or multiple sequence alignments of homogeneous species and have played an important role in predicting novel genes and exons that had escaped transcriptome profiling and corrected previous gene annotation. Especially, with the recent increase in annotation data, the homology-based comparative methods significantly improve predictive performance via investigating the homologous database of annotated mRNAs, proteins, peptides, and other biological elements. However, computational methods are still far from satisfactory in both sensitivity and specificity. More scientists realize that using only one method is not enough for predicting genes with high sensitivity and high specificity: ab initio methods often lack the high sensitivity on the predictive results while comparative methods are prone to lose specificity. Thus, ab initio and comparative methods are often combined to maximize the predictive performance.
Additionally, NGC generates a high-throughput data of RNA sequencing (RNA-Seq) and further verifies that potential genes and alternative coding regions are often hidden in DNA genomes and that the latent patterns need to be discovered. Despite the increasing volume of data, the three categories of methods mentioned above are still effective in computationally finding the potential genes and coding regions from the new incoming data.
In this review, we provide a general outline of the conventional gene prediction approaches rather than give too many details about the methods and algorithms themselves. However, some methods and tools are described and depicted to this end, but we do not cover them exhaustively. Readers who are interested in the technical details are encouraged to look at the original papers cited in this paper. This paper is organized as follows: in Section 2, we introduce the preliminaries of gene detection. In the Sections 3, 4, and 5, the basic methods of the three main categories in gene prediction techniques, including ab initio, comparative methods, and hybrid methods, are discussed, respectively. In Section 6, the evaluation metrics and the typical dataset are given to assess the performance of computational methods. In Section 7, we conclude this review, discuss the related issues, and provide a possible direction in regards to future work in gene prediction.
2. Preliminaries
In some literature [8–10], the useful information in a DNA sequence that was adopted as the determinative criteria of computational approaches can be divided into two parts: content sensors and signal sensors. As their names imply, content sensors are variable-content DNA characteristics, such as exons, introns and intergenic regions, while signal sensors are short nucleotide signals, such as splice sites, start codons, and stop codons. A successful tool for gene prediction usually adopts the method of combining these sensors to increase specificity and sensitivity performance.
In prokaryotes, due to high gene density and the rare presence of introns, gene prediction is relatively easy. However, genes may often overlap each other and the translation starting sites may result in another hurdle that must be correctly predicted. In an eukaryotic genome, validating the real joint sites between exons and introns is an open problem because of the interruption of embedded introns between exons and the existence of alternative splicing sites.
2.1 Gene Structure
The design of gene detection methods mainly relies on genetic characteristics in the structure of the gene, such as promoters, GC content, start and stop codons, coding regions, splicing sites, exon and intron lengths, and the compositional properties of coding and non-coding. Fig. 1 depicts the standard model for general biological processes that shed light on sequence information. The information is further integrated into almost all computational approaches as the criteria for determining entire gene structures. However, identifying these real signal sensors is difficult because genomic sequences contain thousands of similar signals/noises that imitate themselves in DNA texture. Moreover, some signal sensors are not fully validated. For example, GC content and the TATA box are thought to be important markers in the promoter. However, recent research shows that the TATA box is not present in all eukaryotic promoters and that about 45% promoters contain a TATA box [11]. Similarly, GC content manifests various levels in promoter regions [12]. In order to deal with these difficulties, every approach has its own strategy for discerning various signal sensors by taking advantage of biological criteria.
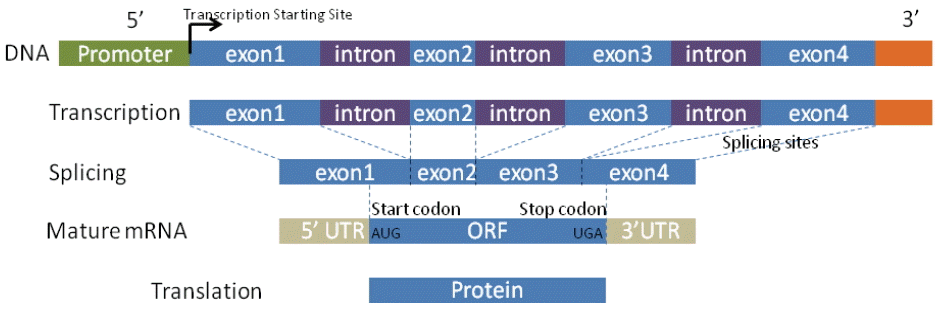
An illustration for eukaryotic gene structure.
2.2 Exon and Intron
Compared with exons, introns are usually not highly conserved even though in recent research some introns have been found to be functionally conserved and to be participating in the protein synthesis [4]. One can view this by saying that exons are somehow isolated by introns in a single gene. Therefore, identifying the relatively conserved exons is the first step in detecting genes. It has also been observed that exons can be categorized into three types: the initial exon that is the first exon in a gene, the internal exon that is the internal exon between the starting exon and the end exon, and the terminal exon that contains the stop codon. A short exon in eukaryotic is usually hard to predict as the additional noises from an intron may hide the limited signals provided by the short length. Many approaches are based on these fundamental observations in order to design their procedures.
2.3 3-Periodicity
Even though ambiguity exists in biological processes, some widely accepted constraints are reliable enough to establish a solid foundation for computational techniques. These constraints are related to coding areas that are highly conserved and strictly encoded by protein synthesis processes. These basic principles include 3-periodicity coding and an unique stop codon in a gene. In other words, the coding areas are 3-periodicity and amino acid codons are always formatted in 3-periodicity. A stop codon cannot occur within a coding region. That is, it only occurs at the end of the coding region and it is impossible to find the stop codon before hitting the translation stop site. Three-periodicity is one of the main constraints for Fourier transform-based and information theory-based methods.
2.4 Splice Sites
Although alternative splice sites for exons/introns were discovered in recent literature [13], the commonly generalized signals for splice acceptor and donor are AG and GT, respectively. These splice sites are punctured along DNA sequences where transcription processes rely on these biological marks, and only 1% dimer of AG/GT are identified as the real splice sites in a DNA sequence. Detecting splice sites [14] is an important subject in gene identification and gene structure studies.
2.5 Start and Stop Codons
In the similar circumstances, widely accepted start codons (ATG) and stop codons (TAG, TGA, TAA) are viewed as the strong signals for identifying the genetic and non-genetic regions. However, as mentioned above, these signals are abundantly contained in DNA genomes and are difficult to use alone for identifying DNA contents. Thus, many probabilistic methods that investigate the mutual relations around signal regions have been developed to determine whether they are real signals.
2.6 Promoter
Each gene in a DNA sequence is capped with a promoter motif. A promoter is closely related with transcriptional starting sites (TSSs). The initiation of transcription is primarily controlled by transcription factors that bind to the vicinal region of the promoter and to the first intron region [13]. Correct detection of the location of the promoter motif in the DNA sequence results in the high probability of gene identification. In current methods, the promoter is sitting in the intergenic regions and does not overlap with the immediate upstream of the gene. This practice is seen as a simplification of complex reality.
3. Ab initio Methods
Ab initio methods can detect genes by systematically examining and discriminating signal sensors and distinct biological patterns as well as being able to distinguish gene regions in a single input sequence. The only criteria this type of method adopts to identify the genes relies on the extracted intrinsic information of DNA sequences. Many ab initio methods largely depend on probabilistic models. Of them, hidden Markov models (HMMs) are the most generative, where the transitions of the nucleotide over finite hidden states are ruled by the probabilities of present and previous appearances.
Ab initio methods are indispensable for gene prediction because these methods use statistical patterns and intrinsic information, especially signal sensors, to detect the boundaries of content and can greatly increase the specificity of prediction performance. On the other hand, one of the disadvantages of an ab initio method is that it requires a large volume of training sets to collect the near-ground-truth statistical properties of various signal sensors, which inherently limits their applicability to low sample sets. Another disadvantage is that since the boundaries are often variable, it results in over-fitting models on small training sets.
3.1 Fourier Transform and Digital Signal Processing
Due to the repetitive 3-periodicity of protein-coding regions, the open problem of finding genes can be handled by the digital signal processing (DSP) methods. Many innovative DSP methods for finding distinctive features of protein-coding regions have been proposed in the past three decades [15]. They primarily focus on discerning the difference between protein-coding and non-coding regions. A distinctive feature of protein-coding regions in DNA is the existence of short-range correlations in the nucleotide arrangement, particularly a 1/3 periodicity [16], arising from the fact that coding DNA consists of triplets [17].
In order to analyze the DNA sequence, the symbolic-to-numeric transformation is necessary as the first step toward genome analysis and processing. Through numerical representations of the DNA genome, DSP-based features are extracted, analyzed, and classified in the spectral domain or the special-temporal domain. A framework called DNA-As-X [18] is generalized for digital signal processing in genome analysis, which is composed of four phases: transformation, feature extraction, signal processing, and inverse transformation. The transformation phase converts the DNA sequences into numeric representations, the feature extraction and signal processing phases are DSP-based feature processing for gene and exon prediction, and inverse transformation is the reverse phase of transformation.
Binary representation is mostly used to represent genome sequences [19], which convert a DNA sequence of four nucleotides, C, T, A, and G, into four separate binary sequences, xC[n], xT[n], xA[n], and xG[n], where 1 or 0 represents the presence or absence, respectively, in the corresponding positions. Other representations include the quaternion approach [15], the electron-ion interaction potential method [20], real-number representation [21], complex number mapping [22], etc.
The most commonly used method in spectrum analysis is the discrete Fourier transform (DFT) [23], as shown in Eq. (1).
where, x[n] is a finite numerical sequence length of length N, n is the sequence index, k is the period of N/k samples and the discrete frequency of 2πk/N. The total Fourier spectra of coding sequences typically have a peak at the frequency k = N/3, whereas the Fourier spectra of non-coding sequences generally do not have any significant peaks [17].
The above example illustrates the common procedure of a DSP method, which is primarily composed of two parts: Fourier transform and spectral augment analysis. The latter stage is based on the former one for recognizing the Fourier pattern at the frequency of 1/3. For many cases, such as short exons, the signal spectrum at 1/3 is suppressed by the noise. Thus, how to augment the signal and eliminate the noise is one of the primary issues in DSP methods for periodicity recognition.
The GeneScan program [23] calculates the signal-to-noise ratio of the peak at k = N/3, as shown in Eq. (2).
where, m ∈{C, T, A, G} and Ŝ is the average of the spectral content of S. P is assigned to 4 as a critical point where the bulk of coding sequences is distinct from almost 90% of non-coding regions having P<4. Based on spectral content measures, the optimization technique [24] is applied to the calculation of coefficients for the spectral content of each spectral sequence according to the known genes of a given organism.
DSP-based methods have a limitation in regards to choosing the window size. A small window size results in sensitivity loss, whereas a large window size pays the price of the dramatic increase in the computing load. In order to improve the performance of predicting small exons, auto-regressive (AR) techniques [25], which are also known as maximum entropy spectral analysis or linear prediction spectral estimation, are proposed as an alternative method for detecting the small genes.
The idea of the AR analysis relies on the assumption that the current sequence is modeled as an AR time series plus a white noise error term. Thus, the spectrum is derived from the AR model parameters and the variance of the error term. The model parameters are found by solving a set of linear equations that are obtained by minimizing the mean squared error term (the white noise power) over the data [26]. In addition, the recursive Marple algorithm [27,28] is often utilized for the order selection in autoregressive spectral analysis and estimating the power spectrum density of the AR model.
Other improvements for short exon prediction are wavelet-based DSP techniques [29,30], which can effectively reduce the noise from surrounding non-coding regions by using a wavelet packet transform [26,31].
As an alternative to spectral analysis on the spectrum of 2π/3, the spectral-rotation method [17] studies the argument by using an argument plane to rotate the four Fourier vectors, Xm[k], m∈{C, T, A, G}, clockwise for a certain angle that is equivalent to the average phase angle in coding sequences so that each of them can point to the same direction. Consequently, the vectors in coding regions can approximately point along the real axis, whereas the vectors in non-coding regions point in different directions. The spectral-rotation measure V is defined as the square of the ratio of the spectral rotation over the corresponding angular deviation, as shown in Eq. (3).
where, μ is the average phase angle, δ is the angular deviation in coding regions, and S is the same spectral content, as defined in Eq. (2). It makes a contribution to spectral analysis methodology by converting the analysis from frequency to argument.
A time-domain method, also commonly known as the average magnitude difference function (AMDF) [32], has been proposed for a numeric DNA sequence, x[n], as a function of the period k = 3, shown in the equation below.
where, N represents the window size. The AMDF[k] can produce a deep null at k = 3 where significant correlation exists. If the period k ≠ 3 is detected, the relatively low AMDF values are produced at non-coding regions compared with high values at coding regions [32]. The time-domain method and the frequency-domain method can be combined to improve the accuracy of the 3-periodicity prediction [33]. Different from the widely adopted parameter of 351 in window size in the frequency domain, the frame size is set to 117 for optimizing the performance of the AMDF method in a time domain [33].
The cross-correlation method is also seen as a novel methodology in genomic signal processing for 3-periodicity prediction, which can be regarded as the convolution of two functions for measuring the similarity. In [29], after a FIR band pass filter of order 8 with a central frequency of 2π/3 was applied to numerical sequences, an impulse train of 3-periodicity was multiplied with the filtered numerical sequences in order to focus on the 3-periodicity property in the exonic region, as shown in Eq. (5).
In addition to digital filter-based approaches for periodicity detection [34,35], some statistical properties [36,37] are often integrated into signal processing methods for detecting the regularities in genetic codes (e.g., codon useage, hexamer counters, codon position asymmetry, different periodicities, autocorrelations, nucleotide frequencies, entropy measures, and so forth).
3.2 Hidden Markov Model and Statistical Methods
The prerequisite of HMM is based on an assumption that the probability of the appearance of a given nucleotide depends on its k previous nucleotides (k is the order of HMM), namely, the conditional probabilities P(Xk+1|X1,X2,…,Xk), where X ∈{C, T, A, G}. The zero-order Markov model is the simplest Markov model, which means that each nucleotide occurs independently with a given frequency. It is believed that the large-order Markov model can better characterize the dependencies between adjacent nucleotides. Some gene prediction methods are constructed as a 5th-order Markov model, which uses compositional words that are 6 in gene characteristic length. However, in [38], it was revealed that models with an order higher than 5 do not make a distinct difference in discriminating the coding and non-coding regions while they significantly increase the computational load.
An essentially semi-Markov model [39–41] has been formulated as an explicit state duration HMM and used for generating an estimator or a parse φ using probabilistic models. A parse or an estimator is composed of an ordered set of states q̄ = {q1, q2, ···, qn} with an associated set of length or duration d̄ = {d1, d2, ···, dn} and the total length of a sequence
In the classical HMM model [39,40,42], generating an estimator can be simply summarized as three essential steps: 1) choosing an initial state q1 in terms of an initial distribution on the states π⃗ = P{q1}, where q1 belongs to one of 27 components, and the conditional distribution of the length for q2; 2) generating a sequence s1 that is conditional on d1 and q1, in terms of the sequence generating model; and 3) generating q2, which is conditional on the generation of q1, according to the first order Markov state transition of Matrix Tij = Pqk+1|qk. The three steps are repeated until the sum of the state duration equals or exceeds the total length L, at which point the final sequence consists of a set of ordered sequence segments, S = s1s2…sn. Four main probabilistic components [40] are needed during the training stage, a vector π⃗ for initial probabilities, a matrix T for state transition probabilities, a set of length distributions f for state length estimation, and a set of sequence generation models P for various states.
Theoretically, the space Ω = ΦL × ΨL contains all possible sets of parses and DNA sequences for the fixed length L where Φ is the set of all possible parses/estimators and Ψ is the set of all possible DNA sequences. The HMM model can be thought of as a measuring function that assigns a probability density to each parse/sequence pair [39,42]. Thus, via the Bayesian theorem, the conditional probability of a particular parse φi ∈ ΦL for a particular sequence S ∈ ΨL can be calculated, as shown in Eq. (6):
This equation illustrates the key idea of the HMM model, which uses the precise probabilistic model to determine which of the possible gene structures has the highest likelihood for a given particular DNA sequence by involving any valid combination of states/lengths and maximizing the probability of the parse. A recursive Viterbi algorithm [43–45] can be used to calculate the maximal probability of the parse φ.
In a similar vein, an abstract statistical framework, called a generalized HMM (GHMM) [42], extracts different regions into finite states and encapsulates the syntactic and statistical properties of each region into state transitions. A GHMM state transition is illustrated in Fig. 2. In addition, many self-training HMMs have been developed for automatic parameter estimation [38,41,46,47].
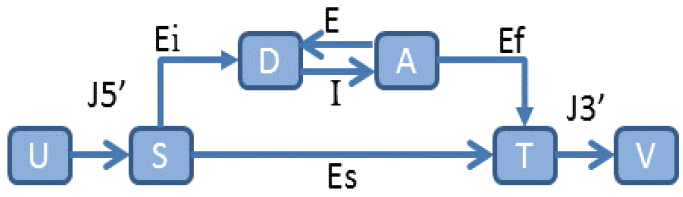
An illustration of a generalized hidden Markov model. J5’ represents 5’ untranslated region, J3’ represents 3’ non-coding region, Ei denotes initial exon, E denotes internal exon, I is for intron, Ef is for final exon, Es represents single exon, D denotes donor, A denotes acceptor, S denotes start codon, T denotes stop codon, and U&V represent particular nodes.
Besides predicting the content sensors, statistical methods, such as the weight matrix method (WMM) [48], can be applied to signal sensor prediction. Three main steps in WMM are: 1) collecting the aligned sequences of fixed-length signal sensors, 2) calculating the frequency of each nucleotide at each position of a fixed-length signal sensor, and 3) estimating the product of probabilities
An extensive method, known as the weight array model (WAM) [51], considers the dependencies of adjacent positions, namely the conditional probability of adjacent nucleotides. The probability of a generated sequence is calculated as the following equation:
where,
The assumptions of WMM and WAM are either independence or dependence between adjacent positions for the signal sensor prediction, such as the acceptor and donor. Whereas, maximal dependence decomposition (MDD) [40,55], a statistical approach, is designed to deal with the dependencies between non-adjacent and adjacent positions. It is derived from an observation in donor signals where significant dependencies are observed from the non-adjacent positions instead of adjacent positions. The core of the MDD approach is a binary subdivision tree with a k-1 level at most, where k is the consensus length. The MDD tree can be constructed by the following steps:
Step 1. For each position of consensus, calculating the sum of the χ2 statistics for matching the variable Ci versus each position Xj for all pairs i, j with i ≠ j.
Step 2. Choosing the maximal sum value in each iteration and dividing the chosen group into two subsets at a certain position i1 according to the consensus.
Steps 1 and 2 can be repeated in each node until the subsets cannot be divided. The composite MDD tree depicts the dependency between parent-child layers and the independence between subsets. It also addresses the biological factors in a signal sensor sequence.
3.3 Traditional and Deep Neural Networks
An artificial neutral network (ANN) is a type of artificial intelligence technique that helps in situations where one cannot formulate an algorithm solution. It also copes with uncertain, imprecise, and approximate problems so as to provide robust and tractable outcomes. These properties make it suitable for predicting protein-coding genes. It simulates the learning process of the human brain and includes supervised and unsupervised learning algorithms for gene prediction [10]. Its architecture relies on the foundation of learning algorithms.
One typical method, known as the gene recognition and analysis internet link (GRAIL), uses a multiple-sensor neural network for gene prediction that was proposed more than two decades ago [56]. The ANN takes a training procedure to learn how to deal with the output of a feature selection and makes an accurate decision about the location of coding regions. To determine the likelihood of a given sequence position, the neutral network extracts the weights of the net from training procedure. In Fig. 3, a typical diagram is generated for ANN and the following features/properties can be selected. For example [56], coding k-mer preferences are computed through the observed k-mers in both coding DNA and DNA genomes; dinucleotide fractal dimension represents the differences in dinucleotide occurrence between the intron and an examined window; word commonality is calculated by summing all k-mer commonalities in the analysis window; the frame bias matrix provides the usage of an amino acid to calculate the correlation coefficient for a reading frame; and the Fickett algorithm considers several properties of coding sequences. The multiple-classifier based method has been experimentally verified to provide better performance than the single classifier neural network [57].

Schematic diagram of neutral network methods.
After the earliest attempt of ANN in gene prediction, many other improved methods have been developed [58–61]. CODEX [59], a program similar to GRAIL, is modeled by physio-chemical measures of DNA sequences, such as melting profiles as well as twist and wedge angles, in such a way that it achieves precise exon prediction in plant sequences. An improved program based on GRAIL [61] uses insertion-deletion detection and a correction algorithm to improve the performance. The system in [60] combined dynamic programming (DP) with ANN in [56] to find the combination of introns and exons by maximizing the likelihood function. The software, GeneParser [50], makes use of content and site statistics to precisely predict the boundaries between introns and exons, which include three individual and multiple-layer neural networks, to combine the information from statistics and databases. The recursive DP algorithm enforces some syntactical constraints in gene structures by approaching the most probable combinations of exons and introns. In addition, this system has the strong error-tolerance capability to cope with an error-prone dataset by using standard backward error propagation methods [62]. A multilayer feed-forward artificial neural network method [63] improves the accuracy by using the 12-dimensional property vector from a DNA sequence as input based on the nucleotide frequencies at three codon positions in the ORFs and the entropy redundancy.
The deep learning (DL) method has emerged as the state-of-the-art technique for genomic sequence analysis [64]. A deep neural network (DNN) is one of implementations in DL, which generally refers to methods that map data through multiple levels of a feed-forward neural network to reveal some intractable and non-linear relation between input data and hidden factors. They can automatically learn complex functions that map inputs to outputs without using hand-crafted features or rules [65].
One of its architectures is shown in Fig. 4(a). The hidden layer h and the iterative estimation of x* can be expressed by calculating their weights, as illustrated in Fig. 4(b). The iteration becomes stable when it has the minimum distance between x and x*. The preliminary ideas of a shallow/deep neural network have been discussed since the 1990s. However, mature concepts about deep learning, including a deep neural network, were not proposed until the mid-2000s [66–68]. Since then, only a small number of works [65,69,70] have applied deep learning in the life sciences, even though it has shown tremendous promise [64]. As a promising method for the future directions of gene prediction, deep learning and other emerging methods are further discussed in Section 7.

An illustration of deep neural network architecture. (a) A toy example, (b) the iteration of one-layer neural network.
3.4 Support Vector Machines and Kernel Methods
Support vector machines (SVMs) and related kernel approaches have demonstrated their capability in accurately predicting various functional DNA signal sensors/features, such as transcription start sites (TSS) and splice sites. The discriminative approaches, like SVM, use binary classification and do not model the complex processes, resulting in many potential modeling mistakes being avoided. In many literature [71–75], the discriminative approaches were thought to outperform other generative methods, like HMM, to some extent with respect to high accuracy, the ability to deal with high-dimensional datasets, and flexibility in modeling diverse sources of data [76,77].
Two key concepts are involved in SVM: large margin classification and the kernel function. The former intuitively separates two sets on hyperplanes far away from each other as possible, and the latter measures the similarity of two points. According to large margin separation, support vector machines can be categorized into two types, hard margin SVM and soft margin SVM. The hard margin SVM is a classifier with a maximum margin to classify all of the input samples that are applicable to linearly separable data, whereas, the soft margin SVM [78] is often applied to non-linearly separable data and allows for misclassified examples by using slack constraints in a convex optimization formula.
According to kernel functions, SVMs can be simply categorized into linear and non-linear. A linear kernel is based on a linear discriminant function in the form f(x) =<w, x>+b, where, x denotes a vector in M-dimensional vector space, w represents a weight vector, b is a bias, and the component is defined as the dot product or scalar product,
Different from linear discriminant functions, non-liner kernels have complex discriminant functions for complicated data examples. Usually, classical non-linear kernels designed for particular applications, including polynomial kernels [76], Gaussian kernels [79,80], spectrum kernels [81], weighted degree (WD) kernels [74], WD kernels with shifts [82], string kernels [83,84], Oligo kernels [85], convolutional kernels [86], and so forth, can be used for modeling more complex decision boundaries in predicting various signal sensors [72,74,87].
Among the aforementioned kernels, other kernels, except for polynomial and Gaussian (also known as a radial basis function) kernels, are often modeled for the purpose of sequence analysis [71]. The input features used for sequence analysis in SVM kernels can be sequence properties such as GC content, dimer, trimer, l-mer, and so forth. For example, for splice site recognition in a spectrum kernel [81], the long sub-strings as input features are more informative than short ones. However, due to mismatching in the long sub-strings, a sufficient length may cause downgrading in predictive performance [83]. The weighted degree kernel shift [82] extends the WD kernel and allows some flexibility in matching sub-strings. Similarly, the Oligo kernel [85] and others closely related to the spectrum kernel [72,84] are extensions of allowing for gaps and mismatches and for achieving the goal via subtly different means.
Kernels compute the similarity of two objects, and a suitable similarity between objects can capture the inherent knowledge in the classification task. Revealing the similarity is an essential task for SVM kernels in sequence studies. The mature local alignment algorithms, such as BLAST, Smith-Waterman, and so on, can be embedded into SVM kernels as a foundation for a highly effective kernel, even if the statistics produced by these algorithms do not satisfy the mathematical condition required by a SVM kernel [88,89]. The general method for using a similarity measure as a kernel is to represent a sequence according to the BLAST scores against a sequence database. Alternatively, the local alignment kernel [90] modifies the alignment algorithms for considering the space of local alignments.
Probabilistic models, such as HMMs, are in wide usage for sequence analysis [91–93] and can be combined with SVM methods. A SVM-based two-layer approach [94] consists of independent SVM signal and content detectors, and hidden semi-Markov (HSM) SVMs. The first layer is SVM feature recognition, while the second layer is gene structure reconstruction. The SVMs integrate task-specific string kernels, including the spectrum kernel, the WD kernel, and the WD kernel with shifts (WDS). The spectrum kernel counts all matching words so that the SVM captures the typical sequence composition. The WD kernel considers matching words at the same position of sequences and the WDS allows for slightly shifted matching. HSM-SVM is similar to HMMs, but it is trained discriminatively. High order content structure and length preferences are exploited and linked to transitions. A scoring function is utilized to comprehend different kinds of features at the position of any nucleotide.
In recent work, novel methods, which primarily integrate new algorithms and data representations into SVM kernels for improving the predictive performance, have increasingly emerged. For example, an algorithmic framework, known as EFFECT [95], uses the evolutionary algorithm in SVM for reducing the computing load and maintaining decent performances. It consists of two stages for recognizing three biological sites of interest. The first stage is used to construct a set of candidate sequence-based features, where the evolutionary feature construction algorithm searches a given space of complex features and identifies a set of features that are effective in a given classification context. The second stage is used to select the most effective subset for the classification task, where an evolutionary feature selection algorithm reduces the set of constructed features. The Z-curve [96], a 3-D curve that provides a unique representation for the visualization and analysis of a DNA sequence [31], is used to generate new features to feed the SVM for delineating the long-range correlations in genes that contain introns [79].
In summary, the SVM allows the use of kernels, which are efficient ways of computing not only scalar products in non-linear feature spaces but also other types of data, such as sequence data. For a further detailed discussion of SVMs and kernel methods, one can refer to the related sources in [76,90].
4. Comparative Methods
When more and more species are sequenced and available in genome sequences, it gives rises to comparative methods for better and faster gene predictions. Homology-based comparative methods are under the assumption that coding sequences are conserved more than non-coding genes are. These conserved areas can be detected by traditional local alignment methods, such as the canonical Smith-Waterman algorithm [8]. The conventional global methods, such as the Needleman-Wunsch algorithm, can also be used for the alignment of sequences with similar lengths.
4.1 Alignment Techniques
An accurate and sensitive alignment technique, Smith-Waterman, is computationally inefficient in aligning a large volume of genome data. Thus, more compact data structures and heuristic methods have been developed, most of which use hash-based techniques, such as BLASTZ [97], BLAT, and MEGABLAST. They usually work on the issues of global genome alignment by searching the query seed of a fixed-length. Many research studies are on how to efficiently design the seed in order to improve the quality of seed searching, since insertion-deletion frequently occurs in genomes and the accuracy can be negatively affected by the coarse granularity of a seed. The improvement of this issue is derived from the spaced seed technique, which allows mismatching for gaps and mutations in a k-mer seed [98,99]. A binary mask [99] assigned to seeds aims to find more flexible error-tolerance patterns or some specific purpose patterns, such as splice sites. For example, a spaced seed that is 11 in length and 8 in weight in the mask 11110110011 allows for mismatching in the 0 positions and exact match in the 1 positions. In human and mouse genome alignments [97] different seeds are applied iteratively to detect the orthologous and paralogous genes between the two mammal species.
However, seed-based heuristic alignments were still far from being efficient when high throughput sequencing technology emerged, especially NGS, which brought a higher volume of genome data to computational terminals [5]. The Burrows-Wheeler transformation using compressed a full-text minute-space (BWT-FM) index enables rapid alignment between a query and the genome. However, it only allows low variation between a query sequence and the subject. In [100], it provided a local successive refinement method to align high error-prone reads in the most recent emerging single molecule sequencing (SMS). It illustrates a paradigm for improving the BWT-FM method for adapting the error-tolerance alignment. In Fig. 5, it shows the general alignment algorithm categories.
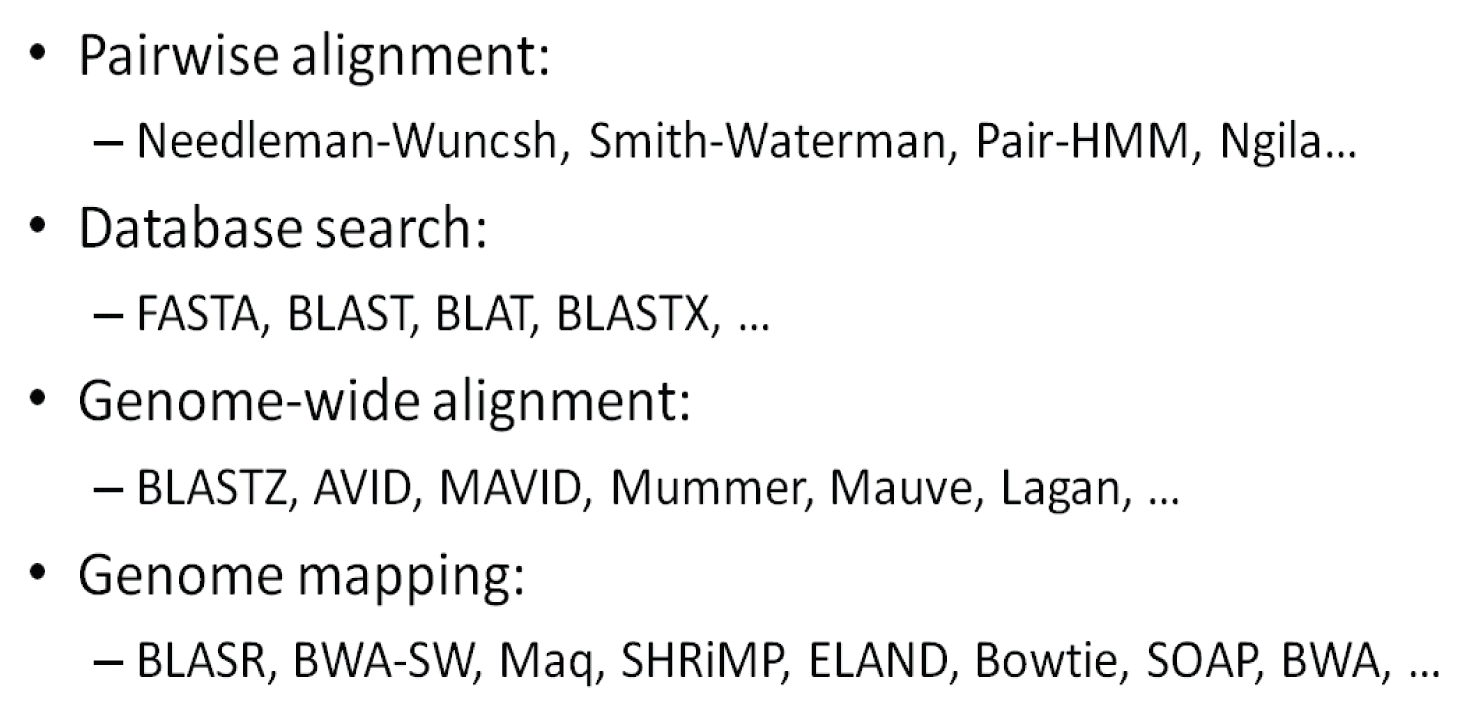
Categories of alignment algorithms.
4.2 Intergenomic Comparison
According to the properties of conserved sequences, homology-based comparative methods can be categorized into two types: 1) gene prediction on expressed sequences, and 2) gene prediction on DNA sequences of homologous species [9,101]. The former, which is also known as intragenomic comparison, includes protein sequences, complementary DNA (cDNA), expressed sequence tags (ESTs), and RNA-Seq transcripts; the latter is about an intergenomic comparison that allows the identification of orthologous genes [8,102].
Homologous alignments between DNA sequences from related species, such as humans and mice, have been used for finding genes and gene structures [103–105] in relatively large genomes. Comparing two homologous genomic sequences between species is believed to help reveal conserved exons and simultaneously allow the prediction of genes on both sequences. ROSETTA [103], SGP1 [101], CEM [106], and Pro-Gen [107] are more specifically designed for the comparison between closely related species. Some methods, such as SGP-1 [97,101] and Utopia [108], can be combined with other pairwise alignment results as input, such as BLAST [109] and MUMMER [104], and can be assembled into a gene model.
In order to deal with high-throughput genomic sequences, genome-wide searching methods, such as TWINSCAN [53], SGP2 [102], and so forth, have been developed for gene prediction where conservative information and syntenic structures are retrieved according to the genomic alignments.
Theoretically, intergenomic comparative methods are not species specific. However, their performance heavily relies on the evolutionary distance between the compared sequences. A large evolutionary distance may cause the loss of a conservation region, while a close distance between species may lead to over prediction. Thus, in practice, expertise knowledge is required for selecting an appropriate evolutionary distance between species so as to allow methods to properly differentiate the coding and non-coding regions from genomes.
4.3 Intragenomic Comparison
Intragenomic comparative methods exploit the products of coding sequences, such as cDNA sequences, ESTs, and amino acid/protein sequences, as the reference database and compare the query sequence with the reference for finding the homologous regions as the possible coding gene. In addition, the latest RNA-Seq promises major advances for gene prediction due to high throughput transcripts. However, the accuracy of gene identification based on RNA-Seq suffers from the ambiguities of mapping and partially contained introns.
Using cDNA sequences as the reference [110–112] is a very reliable way to identify exons when the genomic sequence and cDNA sequences are from the same or closely related species [113]. Although fully expressed cDNA sequences are the most direct experimental evidence for revealing gene structure, which is obtained by reverse transcription from mRNAs or from the complete clones of targeted individual genes due to the fact that cDNAs contain untranslated regions and there may be alternative splice sites, the experimentally obtained cDNA sequences often do not correspond to annotated genes [13], which results in the bias of predictive results.
ESTs are subsequences of cDNAs and can provide clues to enable the identification of potential exons. EST-based comparative methods [114–117] illustrate an efficient way to elucidate the gene structure from EST matching. However, due to the following reasons: 1) the large number of ESTs, 2) error-prone sequence readings, and 3) limited global information, using an EST database may not lead to the identification of a complete gene. Moreover, since most ESTs encompass only a portion of the mRNA sequence, it is more difficult to predict the coding region from the EST sequences than from cDNA sequences [8].
The advent of next generation sequencing technology [118] raises expectations that full-length transcripts could be generated by assembling RNA-Seq reads. As a result, RNA-Seq data have gradually emerged as a means to replacing EST sequences for gene identification for the limitation of EST data [119–121]. However, the use of the assembled RNA-Seq transcripts is often far from trivial because the assembly of transcripts from a RNA-Seq reads as error-prone, which is the gradually formed consensus among bioinformatics practitioners [122]. Consequently, this results in that fast and accurate mapping of assembled transcripts for ab initio gene finding becomes difficult. Thus, the latest methods for gene identification in RNA-Seq transcripts often involve a variety of methods. For example, the novel method in [47] integrates unassembled RNA-Seq read alignments into the self-training procedure of the GeneMark-ES program to improve the accuracy of gene prediction.
Compared with the two types of sequences mentioned above, the gene products of gene expression and protein sequences, including the peptides from proteomics experiments [123], provide more reliable evidence for gene prediction [9,124–127]. The selection of a protein database [128] can be retrieved simply from a BLASTX search. All possible exons are explored by translating the exons and aligning them with the target protein sequences. The matching/mismatching scoring system can refer to the PAM matrix [129] or BLOSUM matrix [130]. As a result, the highest similarity score to the target protein sequence can be generated. A protein model [119] is integrated into gene prediction and aims to improve the accuracy of protein-based comparative methods by first identifying the member of a given protein family from the protein database and then evaluating the DNA mapping via the Viterbi algorithm. The disadvantage of general protein-based comparative methods is that since most proteins are derived from manual annotation countless new exons may not be detected by comparing the existing protein database.
Additionally, comparative genomics is regarded as the most powerful tool for detecting the conservation if the aligned genomes cover a range of evolutionary distances. An improved comparative method is proposed in [131] to mitigate the problem of low specificity in exon prediction by exploiting a probability model of dependency between adjacent codons, which greatly improve specificity with little sensitivity loss.
These categorized sequences provide extrinsic evidence for finding the interest contents in the subject sequence. The underlying principle of the homology-based methods is to use a homology comparison to detect extrinsic content sensors, especially the exons, the majority of genes. After finding the exons, chaining algorithms and signal sensors are applied to identify the boundaries and chain them together into a syntenic combination.
4.4 Chaining Technique
The procedure of chaining exons occurs only after exon candidates are predicted. In comparative methods, after local alignments the high scoring segment pairs (HSPs) need to be filtered and chained into a syntenic gene structure. Therefore, the chaining problem can be briefly described as follows: given a set of putative exons or weighted intervals, the goal is to find a maximum set of non-overlapping putative exons or weighted intervals. That is, the alignment algorithms generate a set of putative exons or homologous sequences as the input for the chaining procedure and the chaining technique needs to find the longest path from among the HSPs. This problem can be solved in linear time using dynamic programming. Many global alignment techniques [9,104,132,133] adopt chaining techniques in order to assemble the HSPs into a gene structure.
5. The Hybrid Trend: Combining Ab initio and Comparative Methods
Hybrid methods integrate the advantages of ab initio and comparative methods into a particular application. The innovation of hybrid methods primarily relies on a novel combination of techniques in the two mainstream methods in order to achieve performance improvement in a particular application. Hybrid methods are comprised of two categories: one is the combination of methodologies and the second is the combination of overlapping results. Even though the latter one looks simpler than the former, the success of a hybrid method heavily depends on the final performance and its particular constraints.
Current state-of-the-art gene prediction methods combine multiple statistical techniques with a homologous database to accurately identify gene features [9]. Some methods develop a hybrid framework to simply combine the advantages of the two categories mentioned above using scripting tools.
In [134,135], the systems combined the ab initio method, such as the artificial neural network, with the comparative method, such as a homology search in proteins and the EST database, to improve the performance of gene prediction. A comparative method in [117] is used by BLASTX query against a protein database to identify the protein-coding regions in ESTs. After finding a candidate from the coding region in sequences, it uses ab initio for sequence prediction.
AUGUSTUS [133] takes into account homologous alignment in additional extrinsic data, such as EST, proteins, and genomic sequences, to reduce the false positives and increase specificity. Its extended version of AUGUSTUS ab initio [119] employs the profiles of multiple protein sequence alignments and models human dynein heavy chain proteins as an evidence to improve the accuracy of the prediction. A similar computational combination between machine learning and comparative methods [136] are used to discover the splice sites. JIGSAW [137], a hybrid method, absorbs several sources of evidence and automates the process of predicting the gene structure. It calculates the relative weight of evidence using statistics generated from the training set, and then uses dynamic programming to combine the evidence. The results in the EGASP evaluation experiment [138] show that hybrid methods are superior to ab initio methods in finding genes and achieves the highest rank in both specificity and sensitivity.
ShortHMM [54] combines a HSM model for signal sensor identification and an intergenomic comparison method for content sensor. The model is trained on the alignments of individual exons, which is different from the usual methods, such as TWINSCAN [54], that are trained on whole genes. As such, the ShortHMM results in a higher sensitivity to exons. Similarly, a probabilistic cross-species gene finding algorithm [139] uses a generalized pair of HMMs to model the alignment between species.
Sequence alignments of unassembled RNA-Seq reads, as described in [47], were fed as the input of the ab initio HMM model for the unsupervised training procedure and the novel combination improved the accuracy of gene prediction. Similarly, in [140] the alignment information was fed to the HMM model for the automatic training process.
A conceptual framework/pipeline [7] has been proposed for hybrid programs and contains sequence similarity and statistical regularity. The scripting-based framework in [141] combines GENEID and TBLASTX similar to TWINSCAN, which integrates GENSCAN and BLASTN. GENSCAN and BLASTN propose a weight-based scoring system to re-score the results from GENEID and TBLASTX by assigning the weights to the outcomes to maximize the high-scoring segment pairs. Furthermore, a hybrid framework [9] was developed by combining BLAST and GeneWise [125] via a scripting tool. This model is more accepted by scientists due to its highly modular design and accessible resources.
In addition to the ab initio + Comparative + Script Tools model, results from many mature tools can be overlapped and combined for the best collection of predictive candidates, which is a pragmatic paradigm in gene prediction for improving the specificity and the efficiency of computational methods [142]. In [143], it combined results from three computational tools, GenScan [40], HMMGene [144], and Glimmer [145], and integrated them into an artificial neural network to refine the best combined outcome.
6. Performance Assessment
Subtle differences in evaluation routines may result in substantial differences in the outcome of a comparison. Although standardized datasets for training and evaluation are often lacking, some performance measures are widely adopted for evaluating the performance of gene identification. Sensitivity, specificity and other metrics are determined in the level of nucleotides, exons, transcripts, and genes [146,147].
6.1 Evaluation and Dataset
The human ENCODE Genome Annotation Assessment Project (EGASP) [138] is a milestone experiment in the computational biology community on the comprehensive evaluation of protein-coding gene prediction programs, which assess state-of-the-art methods by testing the ENCODE [3] regions of human genome. The pilot experiment selected 30M sequences within 44 regions that represent 1% of human genomes from the ENCODE project [2] since the latter has achieved great success in a collaborative effort between many top-tier laboratories to identify all functional elements in human genome sequences and because the high-quality gene contents of ENCODE regions have been annotated [3]. Additionally, 11 previous gene annotation tracks published in UCSC Browser [150] were also used in the experiment, where the gene prediction programs were evaluated by comparing their results with the annotation benchmarks [9].
Another similarly comprehensive evaluation project, the Nematode Genome Annotation Assessment Project (NGASP) [149], evaluates different types of gene finding programs on the C. elegans genome that has been well annotated by scientists [150]. About 10% of the C. elegans genomes were selected as the dataset in the evaluation experiment, including 1M genomic sequence regions separately for the training set and testing set. Meanwhile, the multiple genome alignments between C. elegans, C. briggsae, and C. remanei, and the alignments of ESTs, mRNAs, and proteins with the C. elegans genome were provided as additional data for different types of methods [9]. The reference gene sets were derived from WormBase [151,152] and were used as benchmarks to measure the results of different programs.
The RNA-Seq Genome Annotation Assessment Project (RGASP) Consortium [153] conducted the comprehensive assessment for the construction of transcripts. Although the project aimed to evaluate the computational programs primarily based on genome alignments, it provided a lot of important information and datasets for gene finding evaluations. More RNA-Seq datasets were obtained from the GenBank repository of short reads.
In addition to these milestone experiments, some classical datasets are often referenced. For example, the Burset/Guigó dataset [146] provides 570 genes as a standard evaluation dataset from many different organisms. Three datasets in [141] were used for evaluating three comparative methods: 1) ROSETTA, 2) SCIMOG, and 3) human and mouse chromosome 22. Two datasets in [154] that were used to evaluate ab initio statistical methods were the 1) HAVANA dataset and 2) the human PAX5 gene on chromosome 9.
6.2 Metrics
The results can be measured at four levels of granularities: nucleotides, exons, genes, and isoforms, in ascending order of accuracy [138]. An isoform is considered to be correct only if all exons are predicted accurately without any false positive exons or partial exons. Thus, an isoform is seen as the most rigorous test. Inferior to an isoform, a gene is tested as being correct when at least one of its isoforms is correctly predicted. A nucleotide is the finest grained level that only considers the coverage in the nucleotide level. The exon level is located between the nucleotide and gene [9,147].
The following standard classification for measurement is defined in one of the levels mentioned above: true positive (TP) is the cases of predicted-as-gene sequences that are known genes, a false positive (FP) is the cases of predicted-as-gene sequences that are non-known genes, a false negative (FN) is the cases of predicted-as-non-gene sequences that are known genes, and a true negative (TN) is the cases of predicted-as-non-gene sequences that are non-known genes. Here, the frequently used measures are listed as follows:
Sensitivity, Sn = TP/(TP + FN)
Specificity, Sp = TN/(TN + FP)
Accuracy, Acc = (TP + TN)/(TP + FP + FN + TN)
Mean correlation coefficient, Mcc = (TP×TN-FN×FP)/[(TP+FN) × (TN+FP) × (TP+FP) × (TN+FN)]1/2
Positive predictive value, Ppv = TP/(TP + FP)
Performance coefficient, Pc = TP/(TP + FN + FP)
F1 score, the harmonic mean of precision and sensitivity
F1 = 2×TP/(2×TP + FP + FN)
7. Discussion and Future Direction
Many biological problems are related to gene identification since it is at the center of genome studies. We discuss some important issues that are closely related to or derived from gene identification. Subsequently, we discuss some novel techniques as a conclusion of this review. These emerging technologies are thought of as promising directions for future research in gene identification and other related issues.
7.1 Relevant Issues
With more and more genes being identified and annotated, some gene-related issues [6] are being studied, some of which are as follows: the identification of alternative splicing sites that determine the loci of introns and exons [155,156]; novel protein-coding prediction, which aims to find novel protein coding regions [136]; ncRNA prediction, which focuses on long or small regulatory ncRNA [157–159] in so-called intergenic regions; and finding other functionally non-genic elements that mainly exist in non-genic areas and play an active role in regulating gene expression [160]. Furthermore, some important biological signals are considered to be relevant to gene structures, such as polymorphism, CpG island, and Methylation, etc. Here, we briefly discuss some of these issues and shed light on the subjects that establish connections with the gene finding problem.
1) RNA-Seq and Alternative Splicing Sites
More than 95% of human multi-exon genes are alternatively spliced, and the alternative splicing process greatly increases the complexity of a species [161]. The splicing regulation occurs at the level of sequence transcripts before transcripts are translated into proteins. The uncertainty of regulatory elements can determine whether exons are kept or removed. The high-throughput RNA-Seq technology provides an extra large volume of transcript data with various splicing sites. Computational methods for predicting alternative splicing sites are highly desirable in understanding the widespread phenomena and exploring the effects of genetic variations on splicing sites [14,162–165]. Recent RGASP experiments [153] implicitly suggest that there is a trend in conducting this type of research and indicate the emergence of challenges and competition related to these issues.
2) Non-coding Elements
Identifying conserved non-genic elements is more difficult than identifying conserved coding genes using comparative methods because non-coding regions have much less sequence conservation than coding ones, and some undiscovered coding regions may bring pattern noise to the processes of recognizing non-genic elements. Comparative methods [166], including pairwise and multiple-wise alignment among ancestrally constructed species, have been adopted to detect non-genic elements. By detecting thousands of conserved non-genic elements and revealing the majority of evolutionarily conserved DNA sequences, a computational framework based on alignments has been applied to zebra-fish, a phylogenetically isolated genome.
Few gene prediction programs are used to address the problem of ncRNA prediction [10], particularly long ncRNA prediction. A new feature, known as SCORE [167], is generated based on a logistic regression function and used as an integrative direction by combining five significant features, such as structure, sequence, modularity, structural robustness, and coding potential, to improve the characterization of long ncRNA elements.
3) Metagenomic Sequences
Metagenomic sequencing has emerged as a powerful tool for exploring environmental organisms without isolation and cultivation [80]. The shotgun sequencing of microbial communities generates numerous metagenomic short transcriptional sequences that are heterogeneous and mixed together. Normal methods for gene finding were designed to work on single genome sequencing data [145]. Since genes in a metagenomic sample are derived from different organisms, the normal approach, such as using a statistical method, cannot produce predictions with high confidence alone [122,168,169]. Therefore, an assembly method for genome-wide mapping is used for preprocessing the metagenomic samples to improve gene prediction since the accuracy of complete genome assembling is greater than 95%. However, the more difficult issue is that many protein-coding regions in a new metagenome are likely derived from a barely detectable homolog of already known proteins [38]. That is, these proteins might only be expressed in very rare circumstances [170]. Consequently, homology-based comparative methods are not capable of identifying genes that have no similarity to the existing protein database.
An evaluation was conducted in [122] for several ab initio gene prediction algorithms on short-read fragment metagenomic datasets, especially error-prone sequencing data. The results showed that the HMM-based FragGeneScan [171] is more sensitive than others, while the Prodigal [172], MetaGeneAnnotator [173], and MetaGeneMark [38] are better suited for low-error sequences. Although many metagenomic methods have been studied (e.g., [169]), it must be noted that most of the proposed computational methods for gene prediction on mixed metagenomic datasets are still thought of as a largely unresolved question.
4) Polymorphism and Gene Finding
Polymorphisms [170,174,175] are studied for unveiling the connection between polymorphism and gene identification. Polymorphisms include single nucleotide polymophisms (SNPs), insertions, deletions, multiple nucleotide polymorphisms, and microsatellites. A lot of research studies are about how polymorphism affects previously identified genes, but little research has been conducted on how polymorphism affects gene identification [170]. A computationally straightforward manner was adopted in [170] to predict protein-coding genes by aligning long ORFs in mRNA sequences along the reference genome. The results showed that more than five thousand putative protein-coding genes do not exist in the reference genome, whereas they are homologous to known proteins. Polymorphisms are thought to play an important role in disrupting ORFs and generating long ORFs that do not exist in the reference sequence.
5) CpG Island and Methylation Region
As crucial biological markers in mammalian genomes, CpG islands (CGIs) have significant relevance to the processes of DNA methylation, transcriptional regulation, epigenetic inheritance, gene mutation, chromosome inactivation, nuclesome retention, and so forth. Methylation region and CGIs are closely related to the protein-coding gene [13,176], particularly gene regulation, and around 50% of CGIs are related to gene promoters and transcription starting sites. However, studies on CGI are not sufficient as it has not been observed to have a fixed pattern or motif, and it is closely related to Alu repeats [177,178], which were often regarded as junk pieces in the DNA genome. In CGIs, some unrevealed principles may play a critical role in transcription regulation [179] and forming an evolutionary force [177]. The redefinition of a CGI [180] and its identification [181] may contribute to gene finding and the studies on CGI and methylation may establish a direct link between epigenetic analysis and genomic studies.
7.2 Emerging Techniques and Future Direction
New computational techniques and trends introduced in this subsection are expected to provide some useful clues for future research, which may be utilized to resolve biological problems. These techniques include deep learning, cloud computing, machine learning, information theory, parallel computing, and hybrid trends. Although some of them have been discussed in Sections 3, 4, and 5 they are summarized here for further discussion.
1) Deep Learning
Deep learning is separately depicted here because it is a specific machine learning technique that is sweeping the scientific community around the whole world. In deep learning, cascades of multiple layers of non-learning processing units are used for feature extraction and transformation in which supervised and unsupervised algorithms are utilized in each layer for classification and pattern analysis, respectively [182]. The multiple-layer architecture in deep learning can easily eliminate the errors generated in a single layer and produce a more reliable output by feeding back the intermediates iteratively. Recently, deep learning techniques have emerged as a pilot computational platform for a variety of scientific applications [183,184], including gene ontology annotation [185] where an auto-encoder artificial neural network has been constructed as a deep learning approach to predict the connections between gene ontology annotations and functions.
In addition, deep learning has a natural link with the prevailing super-computing techniques, such as graphic processing unit (GPU) computing, because GPUs are particularly well suited for the matrix calculation that deep learning generates for the training process. Consequently, GPU algorithms in deep learning can speed up the training stage by the order of magnitude [186].
2) Cloud and Parallel Computing
Cloud computing is a convenient, ubiquitous, and modern computing model for the rapid provision and release of computing resources based on high speed network access to a shared pool of configurable computing resources. Some particular cloud computing algorithms have been developed to resolve biological problems [187–189], especially for handling the issue of a large volume of data and processing compute-intensive tasks.
Parallel computing can carry out the calculation simultaneously. The prevailing computing techniques, such as cloud computing, GPU computing, and distributed computing, are seen as the concrete forms of parallel computing techniques. Corresponding to two main types of computational tasks, data-intensive (large datasets) and compute-intensive (dense calculation tasks), different algorithms and architectures are designed for tackling these different tasks. In computational biology, particularly in gene prediction and its related fields, large amounts of biological data have been generated from new generation sequencing and more sophisticated methods have been developed for calculating the models and mining the hidden patterns. Making use of the merits of parallel computing, it is expected to mitigate the dilemma created by increasing data volumes and complex models.
3) Information Theory
Information theory involves interdisciplinary knowledge on applied mathematics, physics, electrical engineering, and computer science, and has a close mathematical connection with signal processing, statistical inference, natural language processing, thermal physics, and many other areas of data analysis. As the most important concept in information theory, information entropy and its extended forms are applied for resolving many problems in computational biology [190–194]. For example, besides being applied in signal processing based methods, several entropic measures [37] for sequence, state, and uncertainty are defined for the Markov analysis to be able to identify the exon and intron. In gene prediction, the information entropy for a sequence property can also be calculated as an optimized feature for machine learning methods [167,195]. Additionally, other signal processing concepts, such as digital filters [196], data compression algorithms [197], and so on, are often seen in gene prediction since they have a natural link in terms of numeric analysis and pattern recognition. In the future, techniques derived from the information theory will perhaps play more important roles in genome analysis.
4) Machine Learning
Machine learning (ML) methods, particularly SVM-based methods, have been a significant methodology in genome analysis for solving a wide range of problems, including gene finding [94,198]. Recently, machine learning based methods [169,199] are being further used for gene prediction in metagenomic fragments. Also, k-mer-based sequence binning methods and sequence property-based methods are often seen as the input for training models. For example, a newly developed SVM-based algorithm [80] can be implemented in a three-stage strategy to predict genes. First, short reads are classified into phylogenetic groups by a k-mer-based sequence binning method. Second, SVM classifiers integrate entropy density profiles of codon usage, translation initiation site scores, and open reading frame length as input patterns for supervised universal model training. Then, protein coding sequences are identified in each group independently with these SVM classifiers.
Although ML methods are penetrating almost every area of scientific research, it is still seldom seen in large-scale data, especially in datasets that are bigger than a terabyte [169] since the training phase of current ML methods cannot be applied to a large-scale dataset, which is a bottleneck for big data studies. One of the feasible solutions, compatible with big data environments, is to design a concurrent pipeline or a novel parallel framework (e.g., MapReduce) [187] to integrate outstanding ML methods into modern high performance context.
5) Hybrid Methods
Various techniques have been creating a trend of convergence between disciplines. As a good example, ML techniques built on the foundation of statistics have absorbed much of its philosophy and many of its ideas over the years [200]. For example, maximum likelihood and Bayesian inference are used for making estimates, and expectation maximization (EM) is employed to handle latent variables. Based on this type of theoretical context, hybrid methods provide a beautiful example of bridging gaps between methods in different disciplines.
Many successful methods illustrated in Section 5 belong to the category of hybrid methods and achieve better performance by combining the merits of different techniques into an integrative pipeline or framework. More and more scientists have realized that hybrid methods are probably the most effective way to deal with complex biological problems. As a result, many novel hybrid combinations have been created as trials to resolve these problems. From this perspective, hybrid methods represent the trend of methodologies. In the previous sections, it has been shown that a significant amount of reviewed work has repetitively verified this trend.
References
Biography
Ning Yu http://orcid.org/0000-0001-8861-0804

He is currently a Ph.D. student in Computer Science in Georgia State University. He received M.Sc. degree in Computer Science from Southern Illinois University Carbondale in 2009. His B.Sc. degree in Computer Science and M.Eng. degree in Signal Processing were received from Communication University of China. His research area includes Data Mining, Bioinformatics, Parallel and Cloud Computing.
Zeng Yu http://orcid.org/0000-0003-3550-3495

He received B.S. and M.S. degrees from the Department of Mathematics, School of Sciences, China University of Mining and Technology in 2008 and 2011, respectively. He is currently a Ph.D. candidate in the School of Information Science and Technology, Southwest Jiaotong University, China. He is also a visiting Ph.D. student in the Department of Computer Science, Georgia State University, USA. His current research interests include data mining, bioinformatics, deep learning and cloud computing.
Bing Li http://orcid.org/0000-0002-8233-5191

He received his B.S. degree in computer science from Michigan Technological University in 2012, and M.S. degree in computer science from Georgia State University in 2014. He is currently a Ph.D. candidate in Computer Science at Georgia State University. His research interests include Cloud Computing, Parallel Computing, and Bioinformatics.
Feng Gu http://orcid.org/0000-0001-5337-4282

He received his B.Sc. degree in mechanical engineering from China University of Mining and Technology in 1998 and M.Sc. degree in information systems from Beijing Institute of Machinery in 2003. He received his M.Sc. and Ph.D. in computer science from Georgia State University in 2009 and 2011 respectively. He was an assistant professor of computer science at Voorhees College from 2010 to 2013. He is currently an assistant professor of Computer Science at College of Staten Island, The City University of New York, and the doctoral faculty member of Graduate Center of The City University of New York. He is the recipient of Natural Science Foundation Research Initiation Award. His research interests include modeling and simulation, complex systems, high performance computing, and bioinformatics.
Yi Pan http://orcid.org/0000-0002-2766-3096

He is a Regents’ Professor of Computer Science and an Interim Associate Dean at Georgia State University, USA. Dr. Pan received his B.Eng. and M.Eng. degrees in computer engineering from Tsinghua University, China, in 1982 and 1984, respectively, and his Ph.D. degree in computer science from the University of Pittsburgh, USA, in 1991. His profile has been featured as a distinguished alumnus in both Tsinghua Alumni Newsletter and University of Pittsburgh CS Alumni Newsletter. Dr. Pan’s research interests include parallel and cloud computing, wireless networks, and bioinformatics. Dr. Pan has published more than 150 journal papers with over 50 papers published in various IEEE journals. In addition, he has published over 150 papers in refereed conferences. He has also co-authored/co-edited 37 books. His work has been cited more than 4000 times. Dr. Pan has served as an editor-in-chief or editorial board member for 15 journals including 7 IEEE Transactions. He is the recipient of many awards including IEEE Transactions Best Paper Award, IBM Faculty Award, JSPS Senior Invitation Fellowship, IEEE BIBE Outstanding Achievement Award, NSF Research Opportunity Award, and AFOSR Summer Faculty Research Fellowship. He has organized many international conferences and delivered over 40 keynote speeches at various international conferences around the world.